
On 25 April 2015, at 11:56 on a Saturday morning, the ground under central Nepal began to shake. Nobody had been warned: not the families at home in Barpak, near where the rock first broke, not the people in Kathmandu’s old brick houses, not the climbers at Everest Base Camp. In under a minute, the Gorkha earthquake had killed thousands of people. In all, nearly 9,000 died.
Nine years later it was different, and also the same. In September 2024, the Department of Hydrology and Meteorology sent out a special bulletin at least five days before the rain came, warning of heavy rain, floods and landslides; three days before, it put most of the country on red, “take action”. The rain fell as forecast, more of it in a day at Kathmandu’s airport than had ever been measured there. Even so, floods and landslides killed more than 220 people, because a warning saves lives only when people act on it.
So some disasters give warning, and some don’t, yet. Why the difference? And for the ones that come without warning, can we still be ready? This topic is about using the record of past hazards, where they strike, how big they are and how often they come, to forecast the next ones, and about the machines and plans that turn a forecast into lives saved.
Hazards leave records
An earthquake, a flood or a landslide is a natural hazard: a natural event that can harm people and what they build. It becomes a disaster when it meets people who aren’t ready for it. A landslide on an empty hillside is a hazard; the same landslide onto a village is a disaster. (How the size of the hazard, the number of people in its way and how well their houses stand up combine into a risk is in the Grades 9–12 topic Why Do People Live Where They Do?.)
You met landslides and floods in Grade 6, and ways to hold the land in place: terraces, trees and gabion walls of stones in wire cages. Those are ways to fight a hazard. To get ready for one, you first need to know three things about it, and these can be read from the record of the past:
- a.Where it strikes.
- b.How big it is.
- c.How often it comes.
Here are Nepal’s main hazards, and what their records show:
| Hazard | Where in Nepal | When in the year |
|---|---|---|
| floods | the Terai, along the big rivers; valley floors in the hills | the monsoon, June to September |
| landslides | the steep hills and mountains, worst where forest has been cut or a road dug into a slope | the monsoon, after heavy rain |
| glacial lake outburst floods | the valleys below glacial lakes in the high Himalaya | most often in summer, when there is most meltwater |
| earthquakes | the whole country | any time, day or night |
| lightning | everywhere, most in the hills and the Terai | before and during the monsoon |
| cold waves | the Terai, under thick winter fog | December and January |
| forest fires | the hills and the Churia | the dry spring, March to May |
The record already tells you a lot. Most of the hazards have a season: you know when to be ready for floods. Earthquakes are the odd one out. They have no season, and no time of day.
Where earthquakes happen
Draw a dot on a map of the world for every earthquake, and the dots don’t fall anywhere at random. They line up in narrow belts, round the edge of the Pacific Ocean, down the middle of the oceans, and along a great belt from the Mediterranean through Iran and the Himalaya to Myanmar. These belts are the edges of the huge pieces, called plates, that the Earth’s surface is broken into (Do Continents Really Move? shows how they move). Nepal sits right on one: India is pushing north into Asia by about 4 to 5 cm a year, and the rock under Nepal is squeezed until it snaps.
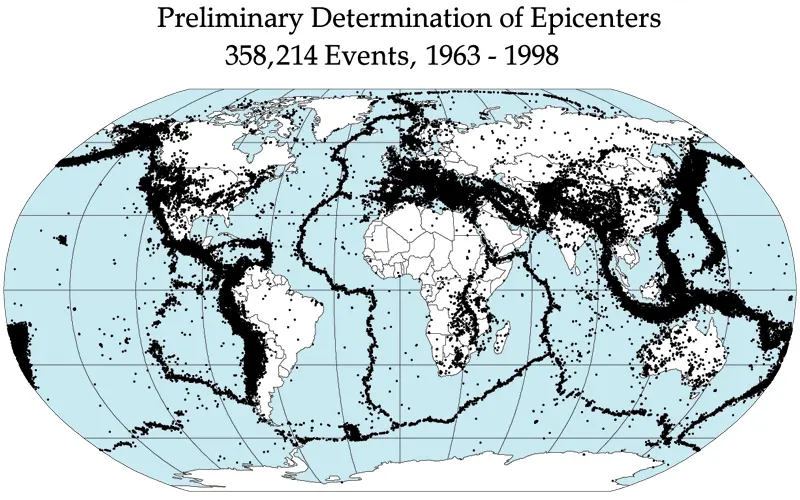
So the record answers “where?” clearly. The whole of Nepal is in the belt, and nowhere in Nepal can count on being safe.
How big, and how often
Seismologists, the scientists who study earthquakes, give each earthquake a magnitude, a number for how much energy it released. Each step up the scale means about 32 times as much energy. A magnitude 7 earthquake releases about 32 times as much energy as a magnitude 6, and about 1,000 times (32 × 32) as much as a magnitude 5.
Count the earthquakes in the record by magnitude, and a pattern jumps out. The United States Geological Survey (USGS), which records earthquakes all over the world, gives these averages:
| Magnitude | How many in the world, on average, each year |
|---|---|
| 8 and above | about 1 |
| 7 to 7.9 | about 15 |
| 6 to 6.9 | about 134 |
| 5 to 5.9 | about 1,300 |
Each step down in magnitude, there are roughly ten times as many. Small earthquakes are common; big ones are rare. Floods follow the same kind of rule: a river has small floods most years, a big one now and then, and a huge one very rarely.
The record of great earthquakes in Nepal
Seismometers, the instruments that record earthquakes, have existed for only about 130 years. For older earthquakes, scientists use two other kinds of record. The first is written: Nepal’s old chronicles tell of earthquakes that knocked down temples and killed kings. The second is in the ground: geologists dig trenches across faults, the cracks along which rock has slipped, and find layers of soil that were broken and pushed up in past earthquakes. Charcoal in the layers can be dated (How Do Rocks Tell Time? shows how layers record time).
Put together, they give a list of great earthquakes in central and eastern Nepal going back nearly 800 years: the ones big enough to bring down much of Kathmandu. (Seismologists keep the name great for magnitude 8 and above. The 1833 and 2015 earthquakes were a little smaller, about 7.7 and 7.8, but they did the same kind of damage.)
In 1255, an earthquake killed King Abhaya Malla of Kathmandu, and, the chronicles say, about a third of the valley’s people. In 1934, on 15 January, the great Nepal–Bihar earthquake killed 8,519 people in Nepal, and thousands more in India, and knocked down a large part of the buildings of Kathmandu, Patan and Bhaktapur.
The average time between events in a record is called their recurrence interval. It is the simplest kind of forecast: “events like this come, on average, about once every so many years.”
Look at the answer to b. The average is 152 years, but the real gaps were anything from 64 to 425 years. An average tells you roughly how often, over a long time. It doesn’t tell you when the next one will come.
In 760 years, central and eastern Nepal had six great earthquakes. What does the record let us say?
Pick an answer to see why.
Some hazards give warning
Two words are used for telling the future, and they mean different things.
- A forecast gives the chance of a hazard, in a place, over some time: “a 70% chance of heavy rain tomorrow”, or “a great earthquake in the Himalaya in the next 50 years is likely”.
- A prediction says exactly when, where and how big: “a magnitude 7 earthquake will hit Pokhara next Tuesday”.
Weather forecasters do both, for a few days ahead. For earthquakes, only long-term forecasts are possible. That is because of what happens before each hazard. Many hazards build up, and you can watch them building. Others don’t.
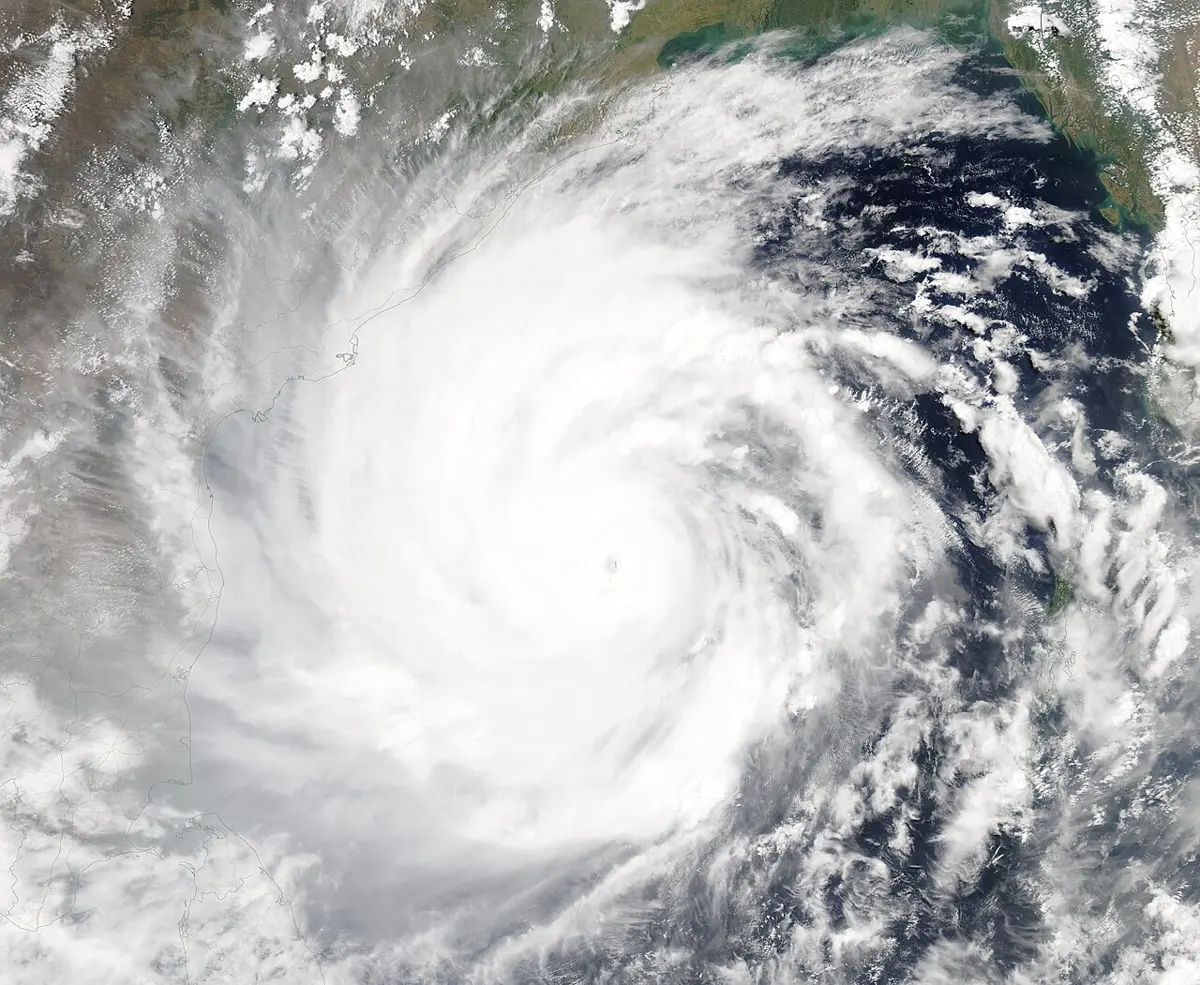
Cyclones, the giant storms of the Bay of Bengal (in other oceans called hurricanes or typhoons), take days to grow over the warm sea. Weather satellites watch them from space the whole time, and forecasters can work out where one is heading three to five days before it reaches land.
Floods on big rivers start as rain in the hills, hours before the water reaches the plains. Rain gauges measure the rain as it falls, and river gauges measure how high the water is rising.
Landslides after heavy rain come when the soil is soaked. Scientists can say how much rain is too much (later in this topic), and forecasters can say a day or two ahead when that much rain is coming.
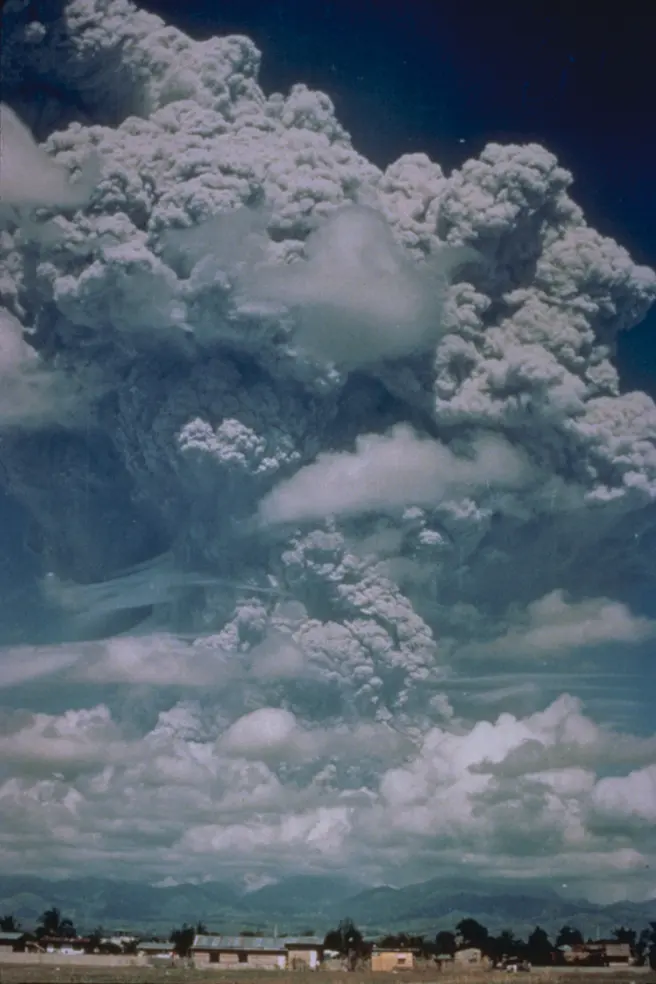
Volcanic eruptions are preceded by signs: magma rising under a volcano sets off thousands of small earthquakes, makes the ground swell, and lets out gases. A volcano that is watched usually gives days to weeks of warning.
Glacial lake outburst floods can come with almost no warning, when an ice avalanche falls into a lake. But the dangerous lakes are known, and watched by satellite as they grow Grade 10: Grade 10: Glacial lake outburst floods, and sensors and sirens below a lake can give the villages downstream the minutes to an hour that the flood takes to arrive.
Earthquakes give no reliable warning. The rock under Nepal is squeezed slowly for centuries, and then, in a second, it snaps. Nothing measurable is known to happen beforehand, every time, that says “it’s about to go”.
Why can floods on the big rivers of the Terai be forecast hours ahead, but earthquakes can’t?
Pick an answer to see why.
Watching the rivers
Nepal’s rivers have gauges: tall measuring posts in the water, marked in meters, and in many places now an automatic sensor that measures the water’s height and sends it by mobile network to the Department of Hydrology and Meteorology (DHM) in Kathmandu. Each gauge has two marks that matter: a warning level, when people downstream should get ready, and a higher danger level, when they should move to higher ground.
When the water at a gauge passes the warning level, a warning goes out downstream: by phone calls to the village disaster committees, by sirens, and by text messages. Since 2016, DHM and the mobile companies have also sent flood warnings as SMS to the phones in the areas at risk along the main rivers. Millions of these messages go out in a single monsoon.
The gauge is useful because water takes time to travel. A flood wave, the hump of high water a heavy rain sends down a river, moves at a few meters per second: on a big river, in this topic’s model, about 10 km an hour. So the farther upstream the gauge, the more time between the gauge seeing the flood and the flood reaching the village.
The widget shows the gauge’s weak spot. A gauge sees only the water that passes it. If a cloudburst falls on the hills between the gauge and the village, the gauge sees nothing, and the flood arrives with no warning. Such flash floods, from very heavy rain on a small, steep catchment, can rise in minutes. That is why DHM is adding more gauges and rain gauges, uses weather radar and satellites to see heavy rain as it falls, and why the forecast of heavy rain, a day or more ahead, matters as much as the gauges.
When does rain set off a landslide?
A hillside stays up because the grains of its soil grip each other. When rain soaks in, the water fills the spaces between the grains and pushes them apart, and the soil gets heavier. Past some point, the grip is too weak, and the slope slides. So the question for a forecaster is: how much rain is too much?
To answer it, the Nepali geologist Ranjan Kumar Dahal and his Japanese colleague Shuichi Hasegawa went through Nepal’s record of landslides from 1951 to 2006. For each landslide whose date they knew, they looked up the rain measured nearby, how hard it had rained and for how long. Then they drew a line along the lower edge of the storms that had set off landslides: below it, landslides in the record hardly ever happened. Their line, published in 2008, is a rainfall threshold:
where D is how long it rains, in hours, and I is the intensity of the rain, how hard it rains, in millimeters per hour. You don’t need to work the power out by hand; the table gives the threshold for some durations:
| It rains for | Landslides start above (mm/h) | Rain in total (mm) |
|---|---|---|
| 3 hours | 31 | 93 |
| 6 hours | 18 | 108 |
| 12 hours | 10.4 | 125 |
| 24 hours | 6.0 | 144 |
| 48 hours | 3.5 | 167 |
Notice the pattern: a short, hard downpour can set off landslides, and so can gentler rain that goes on for days. The longer it rains, the less rain per hour it takes. Above about 144 mm in a day, Nepal’s hill slopes are at high risk of landslides.
A threshold turns a weather forecast into a landslide warning. If forecasters expect 150 mm of rain in the next day over a district, and the threshold for a day is 144 mm, the district can close risky roads at night, and families below the worst slopes can sleep somewhere safer. Thresholds like Dahal and Hasegawa’s are the basis of landslide early warnings in Nepal.
Why is Dahal and Hasegawa’s threshold drawn from the record of past landslides, and not worked out from a formula about soil?
Pick an answer to see why.
Earthquakes: where and how big, but not when
So the record tells us where earthquakes will strike: everywhere in Nepal. It tells us how big: a great one, of magnitude 8 or so, from time to time. It tells us roughly how often: every century or two. It can’t tell us when. Is that no use at all?
It is a great deal of use. A long-term forecast is enough to plan for, because the way to survive an earthquake is mostly decided long before it comes: by how the buildings were built. A seismic hazard map shows how hard the ground is likely to shake in each place over the next 50 years, worked out from the record of past earthquakes. Engineers use it to decide how strong a building must be. After the 1988 Udayapur earthquake, Nepal wrote a building code, rules for building safely, published in 1994; after 2015 it was rewritten, as the code of 2020. Most of the people killed in 2015 died in houses that fell down. The same shaking, in houses built to the code, kills far fewer.
A few seconds of warning
There is one kind of earthquake warning that does work: not before an earthquake, but in its first seconds. An earthquake sends out two main kinds of waves through the rock:
- P waves (primary) are the fastest, about 6 km/s in the rock near the surface. They shake the ground a little.
- S waves (secondary) follow at about 3.5 km/s, and they do most of the damage.
Seismometers near the fault feel the first P waves, and computers work out in a few seconds where the earthquake is and how big. A warning then flies out by radio and mobile network at the speed of light, far faster than any wave in rock. Places far enough away get it before the S waves arrive. This is an earthquake early warning.
Twenty seconds sounds like nothing, but it is enough to get under a strong table, for a surgeon to lift the knife, for a gas supply to shut, and for trains to brake. Mexico’s early warning began working in 1991, and in 1993 became the first in the world to warn the public. It was built after an earthquake off its Pacific coast in 1985 killed thousands of people in Mexico City, about 300 km away. Its sensors on the coast give the city up to about a minute’s warning: loudspeakers across the city sound an alarm.
An earthquake early warning system has been installed. What does it do?
Pick an answer to see why.
From data to designs
A forecast saves lives only when people can act on it, and there is nearly always some technology that helps them act: something designed and built to lower the harm. Some are global, others local.
| Hazard | Watching it | Lowering the harm |
|---|---|---|
| cyclone | weather satellites; forecasters’ computer models | cyclone shelters on stilts; warnings by radio, flags and volunteers with megaphones |
| river flood | rain and river gauges; text-message alerts | embankments; houses and hand pumps on raised plinths; keeping new houses off the floodplain |
| landslide | rain gauges and forecasts, with rainfall thresholds | terraces, trees, gabion walls and drains on the slopes; closing roads in very heavy rain |
| glacial lake | satellites measuring the lake; sensors at the lake | sirens below; lowering the lake through a cut channel, as at Tsho Rolpa (2000) and Imja (2016) |
| earthquake | seismometers; hazard maps from the record | the building code; strengthening old schools and houses; early warning |
| lightning | lightning sensors | lightning conductors on tall buildings (Grade 7) |
The clearest example of what all this can do is Bangladesh, on the Bay of Bengal, where the Ganga, the Brahmaputra and the Meghna reach the sea. Much of its coast is only a meter or two above the sea, and a cyclone’s winds pile the sea up into a storm surge that floods the land for kilometers inland.
In 1970 the Bhola cyclone killed somewhere between 300,000 and 500,000 people, one of the deadliest storms ever recorded. There were few warnings that reached the villages, and in the whole country there were only 44 cyclone shelters. Afterwards, Bangladesh set up its Cyclone Preparedness Programme: tens of thousands of trained volunteers (today about 76,000, half of them women) who carry warnings from village to village by megaphone and raise warning flags, and who help people to shelters. Satellites came to give days of warning.
In 1991 another cyclone still killed about 139,000: there were still only a few hundred shelters, and many people could not reach one, or did not believe the warning. After that, thousands of strong concrete shelters were built on stilts, many of them schools. Cyclone Sidr in 2007 was at least as strong as the Bhola cyclone, and killed about 3,400 people. Cyclone Amphan in 2020 killed about 26 people in Bangladesh, while more than two million were moved to shelters. The cyclones had not become weaker; the people had become more ready.
Will the past still tell us the future?
Every forecast in this topic uses the record of the past. That works only if the future behaves like the past. For earthquakes it will: the plates move at the same speed for millions of years. For floods, landslides and glacial lakes, it may not. You learned in Grade 8 that an increased greenhouse effect warms the Earth and changes the water cycle, with heavier rain and more floods, and melting glaciers filling glacial lakes Grade 8: Grade 8: Effects of an increased greenhouse effect. Warmer air holds more water vapor, about 7% more for each degree Celsius, so the heaviest downpours get heavier. A flood that the record says comes once in 50 years may come more often in future. So forecasters must keep measuring, and update the record every year.
Keep a record yourself
Questions
Which of these hazards can usually be forecast days ahead?
Pick an answer to see why.
A seismic hazard map shows that a town is likely to shake strongly at some time in the next 50 years. What is the best use of this forecast?
Pick an answer to see why.
A village keeps a record of the highest the stream rose each monsoon. In these 20 years (a made-up record), it flooded the road in 2006, 2007, 2013, 2019, 2020 and 2024. The record starts in 2005.
- a.How many floods in 20 years? On average, about how often does the road flood?
- b.In 2025 there was no flood. Does that make a flood in 2026 more likely, less likely, or neither? Explain.
- c.Suggest one reason the floods might become more frequent in future.
Answer
- a.Six floods in 20 years, so on average one every 20 ÷ 6 ≈ 3.3 years: roughly one year in three.
- b.Neither, as far as this record can tell. Each monsoon brings its own rain; a dry year doesn’t “save up” a flood, and a wet year doesn’t use one up (2006 and 2007, and 2019 and 2020, show floods in back-to-back years). The best forecast for 2026 is the same as for any year: about a 1 in 3 chance.
- c.Any one of these: a warming climate makes the heaviest rains heavier; forest cleared on the hills above lets rain run off faster; a new road or houses narrow the stream’s channel; landslides fill the streambed with rock and soil.
Explain the difference between a forecast and a prediction, using earthquakes in Nepal as your example.
Answer
A forecast gives the chance of a hazard in a place over a period of time. For example, from the record of great earthquakes, we can forecast that a great earthquake (magnitude about 8) will strike somewhere along the Himalaya in Nepal again, perhaps within a century or two, and hazard maps say how hard each place is likely to shake in the next 50 years. A prediction names exactly when, where and how big: “a magnitude 8 earthquake will hit western Nepal on 3 March”. Earthquakes can be forecast, but nobody can predict them, because the rock gives no reliable sign before it snaps.
A river gauge is 30 km upstream of a town. A flood wave moves at 12 km/h, and sending the warning takes 15 minutes.
- a.How much warning does the town get?
- b.The town wants 4 hours’ warning. Where should a second gauge go?
- c.Give one reason a gauge, wherever it is, can’t always warn the town.
Answer
- a.Travel time = 30 km ÷ 12 km/h = 2.5 h. Minus 15 minutes (0.25 h): 2.25 hours, 2 hours 15 minutes.
- b.The wave must take 4 + 0.25 = 4.25 h to travel from the gauge: 12 km/h × 4.25 h = 51 km upstream of the town (or farther).
- c.A gauge sees only the water that passes it. Heavy rain falling between the gauge and the town (a cloudburst on a nearby stream) makes a flood the gauge never sees. Or the gauge itself can fail: be swept away, lose power or its phone signal, or, as at Chisapani in 2014, be overtopped by a river higher than it was built to measure. So forecasts of heavy rain, and more gauges, are needed too.
Use the landslide threshold table. Forecasters expect 80 mm of rain in 3 hours over a hill district, and separately, another district expects 160 mm over 48 hours. Which district should close its hill roads? Show your working.
Answer
District 1: 80 ÷ 3 = 26.7 mm/h, below the 3-hour threshold of 31 mm/h. Below the threshold.
District 2: 160 ÷ 48 = 3.3 mm/h, just below the 48-hour threshold of 3.5 mm/h (167 mm in total). Below, but only just.
Neither storm crosses the threshold, so neither district’s forecast says landslides are likely across the district. But both are close, a forecast can be wrong by a lot, and slopes cut by new roads slide more easily. A careful district would warn drivers, watch the rain gauges hour by hour, and be ready to close the roads if the rain comes heavier than forecast. (A threshold is a guide drawn from the record, not a guarantee.)
In 1970 a cyclone killed between 300,000 and 500,000 people in Bangladesh. In 2020, Cyclone Amphan killed about 26. Using evidence from this topic, explain what changed, and why the change was not in the cyclones.
Answer
The cyclones were alike: Sidr in 2007 was at least as strong as the 1970 cyclone, and all of them brought storm surges onto the same low coast. What changed was how ready people were:
- Forecasts: weather satellites now track cyclones for days, so forecasters know where one will hit.
- Warnings that reach people: the Cyclone Preparedness Programme’s tens of thousands of volunteers carry warnings to every village, by megaphone and flags.
- Somewhere to go: from 44 shelters in 1970 to thousands of raised concrete shelters, many of them schools.
- Practice: people know what the warnings mean and where to go, so in 2020 more than two million were moved in time.
So the hazard stayed the same, but the disaster was much smaller. (Cyclones still destroy houses, crops and boats: lives have been saved far more than livelihoods.)
Your school is in Kathmandu. Design a plan to protect its students from earthquakes. Say what you would do before an earthquake, in the first seconds, and afterwards, and how you would test whether your plan works.
Answer
A good plan has all three parts and a test.
Before: have an engineer check the buildings against the building code, and strengthen any that fail (steel bands, or new walls tied to the roof); fix heavy cupboards and shelves to the walls; agree on a safe open place outside, away from walls and power lines; keep a first-aid kit, water and a list of every student’s family contact.
In the first seconds: “drop, cover and hold on”: get under a strong desk and hold on to its legs, away from windows, until the shaking stops. Don’t run for the stairs while the building shakes. If the area has an early-warning alarm, use its seconds to take cover.
Afterwards: walk out calmly, by planned routes, to the open place; count every student; give first aid; don’t go back in until the building has been checked; send students home only to a known adult.
Test: hold practice drills, unannounced, several times a year, and time them: how long it takes everyone to take cover, and to get out and be counted; ask what went wrong, and change the plan.
Where to go next
- Is the Earth Really Getting Warmer? The record of temperatures, and why tomorrow’s floods and glacial lakes may not be like yesterday’s.
- Do Continents Really Move? Why earthquakes line up along narrow belts, and how India came to be pushing into Asia.
- Can You Design an Earthquake-Safe House? In the Grades 9–12 book: what shaking does to a house, and how engineers design one that stands.