
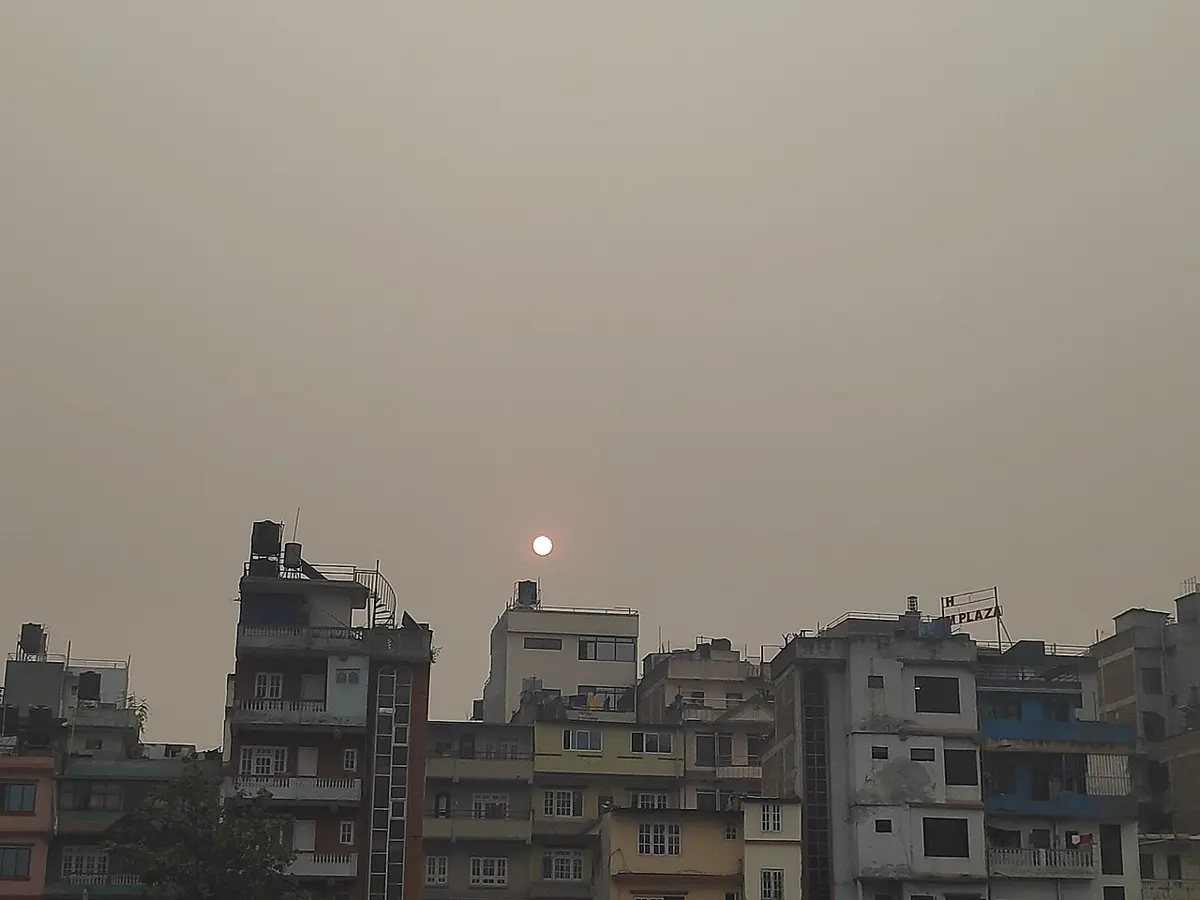
On a winter morning in Kathmandu the Sun comes up as a pale orange disc you can look straight at. The hills around the valley have gone. By afternoon the air is clearer, and by evening the haze is back. Everyone can see that the air is dirty. But how dirty? Dirtier than last year, or cleaner? Dirtier in Ratna Park than in Kirtipur? Bad enough to keep children indoors?
At the end of March 2021, smoke from thousands of forest fires filled the valley, and the government closed schools across the country for several days. That decision wasn’t made by looking at the sky. It was made from numbers: the readings of instruments that count the tiny particles in every cubic meter of air.
You know many ways to cut pollution. This topic is about the step that has to come first, and again at the end: measuring. How do instruments find out how much dirt is in the air? Where and when should you measure, and how many times? And how can measurements tell you whether a fix has really worked?
What is in dirty air?
Dirty air carries two kinds of pollution. Some are gases: carbon monoxide from engines, sulphur dioxide and nitrogen dioxide from burning coal and diesel (the gases that make acid rain, from Grade 8: Acid rain), and ozone. The rest are particles: tiny specks of soot, dust, smoke, ash and droplets, floating in the air. Scientists call them particulate matter, or PM for short.
Big particles, like the dust a bus kicks up, fall to the ground in minutes, and if you breathe them in, your nose and throat catch most of them. Small ones float for days and go deep into your lungs. So particles are sorted by size:
- PM10: particles smaller than 10 micrometers across. (A micrometer, µm, is a thousandth of a millimeter.)
- PM2.5: particles smaller than 2.5 micrometers across, the fine particles. They are small enough to reach the tiny air sacs deep in the lungs, and the smallest pass into the blood.
Fine particles are the part of air pollution that does the most harm to health. Breathed in day after day, year after year, they make lung and heart disease, strokes and lung infections more likely. One study estimated that air pollution of all kinds, outdoors and from smoky cooking fires indoors, cost about 42,000 lives in Nepal in 2019, and fine particles caused most of that harm. That is why PM2.5 is the number most people mean when they ask how dirty the air is.
Where do Kathmandu’s particles come from? Measurements of the particles caught on filters in the winter of 2012–13 traced them mostly to vehicles, dust from roads and building sites, burning wood and rubbish, and brick kilns, with some carried in from forest fires and the plains to the south.
Why do scientists care more about PM2.5 than about the big dust you can see settling on a windowsill?
Pick an answer to see why.
Measuring by weighing
How do you measure something too small to see? The simplest way, and still the one every other instrument is checked against, is to catch it and weigh it.
A pump pulls air through a filter at a steady rate. On its way in, the air passes through an inlet shaped so that particles bigger than 2.5 µm are too heavy to follow the air round a sharp bend, and are caught. Only the fine particles reach the filter. After 24 hours the filter is taken out and weighed on a balance so sensitive that it can weigh a millionth of a gram (1 microgram, µg). The gain in mass is the mass of fine particles in all the air that passed through.
The concentration of PM2.5 is the mass of particles in each cubic meter of air:
measured in micrograms per cubic meter, µg/m³. A cubic meter of air is about the air in a large cupboard, or what you breathe in about two hours sitting still.
The flow of 16.7 liters a minute isn’t chosen at random: it is a cubic meter an hour, so a day’s sample is always 24 m³.
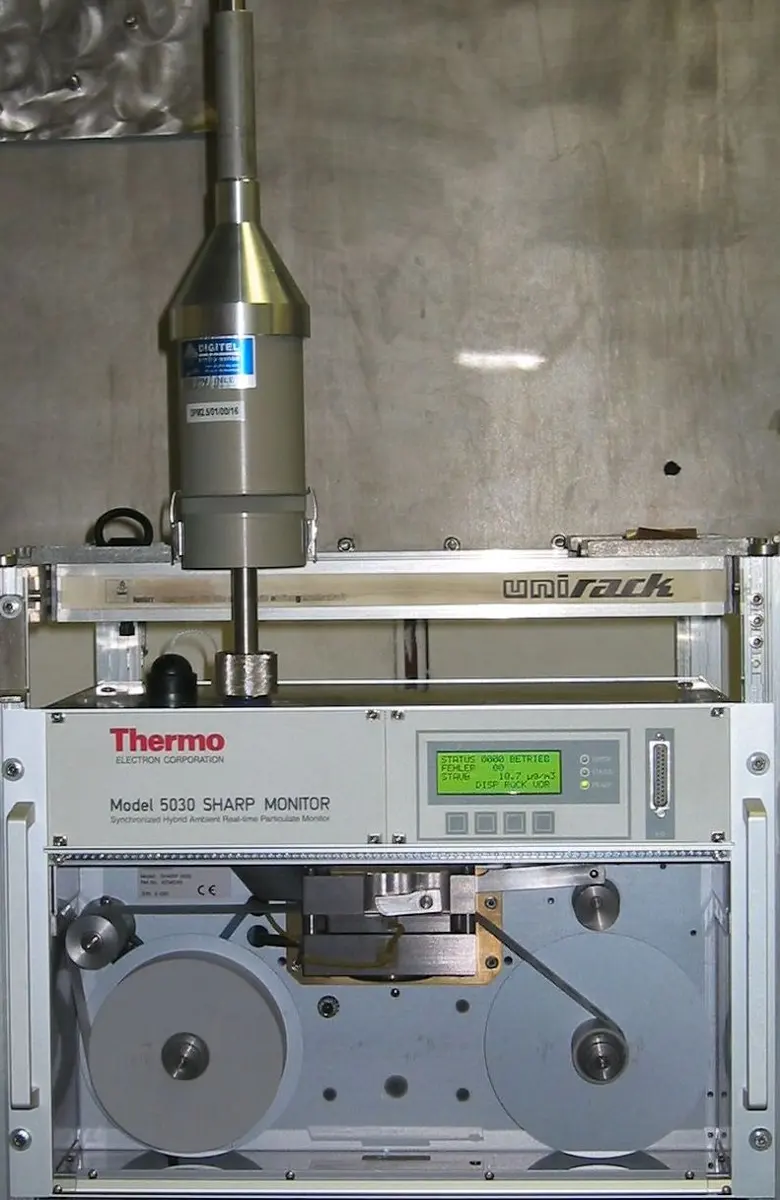
Weighing is accurate, but slow: you learn yesterday’s air today. So monitoring stations use machines that do much the same thing automatically, every hour. One common kind, the beta attenuation monitor, pulls air through a strip of filter tape. A tiny radioactive source on one side of the tape sends out beta particles (fast electrons), and a detector on the other side counts how many get through. The more dust on the tape, the fewer get through. Every hour the tape moves on to a clean spot.
A sampler catches 1,200 µg of fine particles from 48 m³ of air. What is the concentration?
Pick an answer to see why.
A cheap sensor that counts flashes of light
A monitoring station’s instruments cost as much as a car, need power, a cool room and trained staff. Since 2016 Nepal’s Department of Environment has set up 27 stations across the country (as of 2023), and in 2017 the United States Embassy set up two more in Kathmandu. That is still only a few for a whole country.
Since about 2015, low-cost sensors have changed that. A sensor the size of a matchbox, costing about as much as a phone, can be fixed on a school wall, connected to the internet, and send a reading every minute. Hundreds of them now give a far closer picture of where the air is dirty than a few stations can.
Inside, it doesn’t weigh anything. A tiny fan pulls air past a laser beam. Each time a particle crosses the beam, it scatters a flash of light onto a light detector. The sensor counts the flashes, and judges each particle’s size from how bright its flash is. Then it estimates the mass, assuming what a typical particle is made of.
That estimate is where things can go wrong. On a humid day, many particles soak up water from the air and swell. The sensor sees bigger, brighter particles and reports more mass than the dry particles really have, while the weighing method dries its filters before weighing them. The sensor also can’t tell a speck of soot from a speck of road dust, which have different densities. Uncorrected, a common brand of sensor reads about 40% too high across the USA, and more on humid days.
So scientists calibrate low-cost sensors: they set them up beside a reference monitor for weeks, compare the two sets of readings, and work out a correction to apply to the sensor’s readings from then on, allowing for the humidity.
Two identical low-cost sensors are fixed side by side on a school roof. One reads 62 µg/m³, the other 64 µg/m³. A reference monitor next to them reads 45 µg/m³. What can you say?
Pick an answer to see why.
From readings to a number people can use
A sensor that reads every minute gives 1,440 numbers a day. To make sense of them, scientists average them: over an hour, a day or a year. Health limits are set for averages, because harm builds up with time:
| Limit for PM2.5 | Average over 24 hours | Average over a year |
|---|---|---|
| WHO guideline (2021) | 15 µg/m³ | 5 µg/m³ |
| Nepal’s national standard (2012) | 40 µg/m³ | none |
The World Health Organization sets its guideline at the level above which harm to health has been measured. A country’s standard is the limit its law sets, and poorer countries often set theirs higher, as a first step. (In 2025 Nepal’s government was discussing a stricter one.) Kathmandu’s yearly average was around 45 to 55 µg/m³ in 2017–2019: about ten times the WHO guideline.
To tell people quickly what the air means for them, most apps turn the PM2.5 concentration into an Air Quality Index (AQI): a number from 0 to 500, in colored bands. The one most apps in Nepal show is the United States’ index, revised in 2024:
| PM2.5, 24-hour average (µg/m³) | AQI | What it means |
|---|---|---|
| 0 to 9.0 | 0–50 | Good |
| 9.1 to 35.4 | 51–100 | Moderate |
| 35.5 to 55.4 | 101–150 | Unhealthy for sensitive groups (children, older people, people with asthma) |
| 55.5 to 125.4 | 151–200 | Unhealthy |
| 125.5 to 225.4 | 201–300 | Very unhealthy |
| 225.5 and above | 301 and above | Hazardous |
Inside each band, the AQI goes up in a straight line with the concentration:
where C is the concentration; and are the concentrations at the two ends of its band, and and the AQI numbers there.
Why the air changes through the day and the year
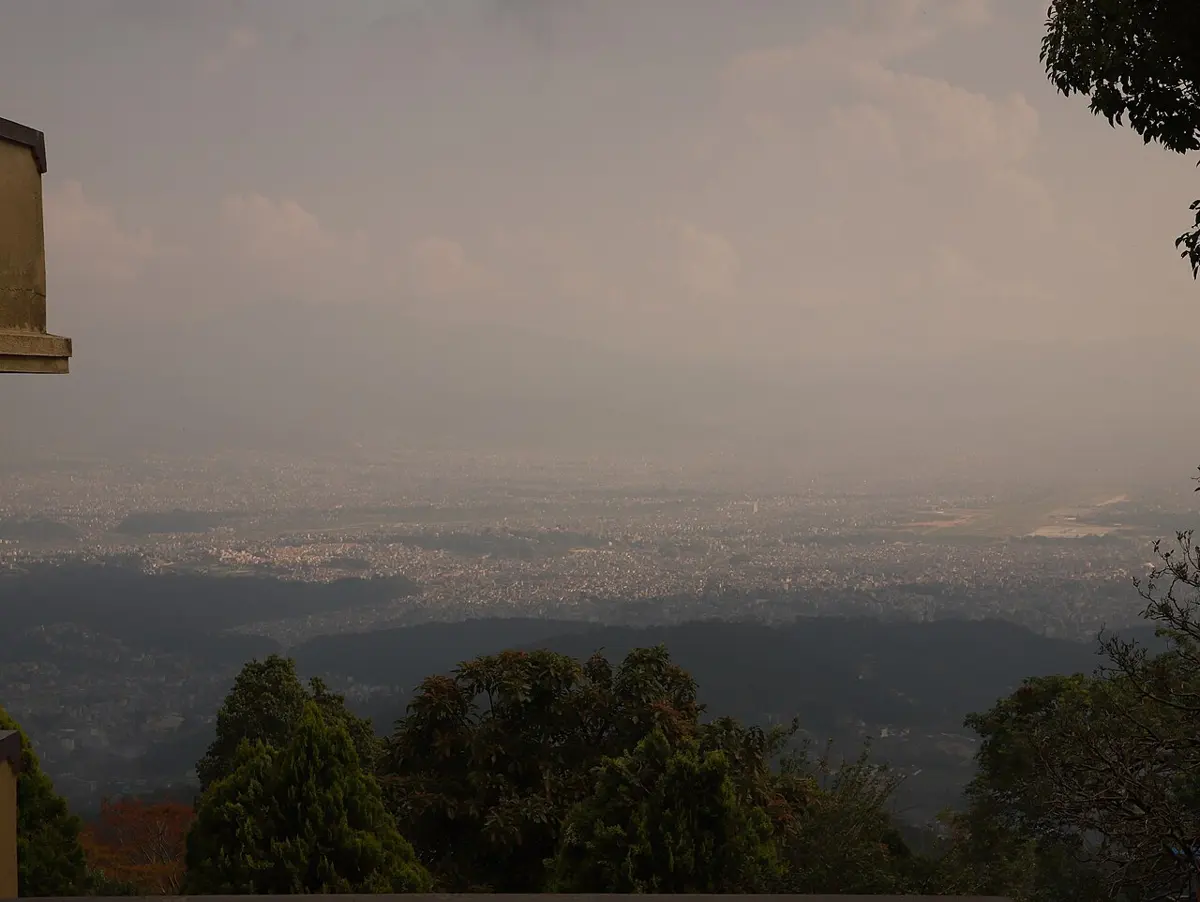
Put a monitor anywhere in Kathmandu and its readings follow a pattern. In winter, PM2.5 climbs to a peak between about 8 and 10 in the morning, falls to its lowest between about 1 and 3 in the afternoon, and climbs again to a second peak in the evening. Why, when the traffic is heavy all day?
The answer is the air above the valley. On a clear winter night, the ground loses heat fast, and chills the air touching it. Cold air is denser, so it stays at the bottom, and slides down the hillsides to collect on the valley floor, under warmer air above. This is a temperature inversion: normally air gets colder as you go up, but here the bottom layer is colder than the layer above it. The cold air is too dense to rise into the warmer air above, so the two layers don’t mix. All the smoke from the evening’s cooking fires, rubbish fires and traffic stays trapped in a layer of air only about 150 m deep, the height of a 50-storey building.
In the late morning the Sun warms the ground, the air near it warms and rises, and the mixed layer, the air that is stirred up, grows. By afternoon it is several hundred meters deep, and winds from the west blow through the valley. The same smoke is spread through several times as much air, and some is blown out, so the concentration falls. At sunset the ground cools, the inversion forms again, and the evening’s smoke builds up.
The seasons follow the same rules. From June to September the monsoon rain washes particles out of the air, clouds stop the ground cooling at night, and the kilns are not fired: the valley’s monitors read around 10 to 20 µg/m³. In December and January there is no rain to wash the air, the inversions are strongest, people burn fires for warmth, and the kilns are working: in January 2019 Kathmandu’s monthly average was about 100 µg/m³, and on the worst days it is far higher. Spring brings dust and, in a dry year, forest fires.
A student puts a sensor on her roof in January and reads it at 2 pm every day for a week. Her average is 45 µg/m³. Is that the day’s average air?
Pick an answer to see why.
Design a way to monitor
Monitoring isn’t just reading an instrument. It is a method, designed to answer a question. Whatever impact people have on the environment, the same steps apply:
- a.The question. Exactly what do you want to know? “Is the air at our school worse at the gate than in the garden?” can be answered. “Is pollution bad?” can’t.
- b.What to measure, and with what. Which pollutant, in what unit, with which instrument; and how you know the instrument reads correctly (calibration, or comparison with a reference).
- c.Where. At the place you care about, at the height people breathe (about 1.5 m), away from things that would fool you: not right above a cooking fire unless the fire is the question, not in a corner where air doesn’t move.
- d.When, how often and for how long. Long enough to cover the day’s cycle and the weather’s changes; at the same times at every place you compare.
- e.Compared with what. A reading means something only beside another: another place, another time, a limit, or a control, a similar place where nothing has changed.
- f.How sure. Repeat the measurements; give the spread as well as the average.
The same steps work for other impacts, with different instruments:
| Impact | What to measure | A simple way to measure it |
|---|---|---|
| a river polluted by sewage | oxygen dissolved in the water; which small animals live in it | a test kit; turn over stones and count mayfly and stonefly young, which need clean water with plenty of oxygen |
| acid rain | the pH of rainwater | pH paper, for every rain, at the same spot |
| rubbish | mass of rubbish thrown away, by kind | weigh a school’s bins every day for a week, before and after a sorting scheme |
| loss of forest | the area covered by trees | satellite photos of the same place, year after year |
| noise | loudness, in decibels | a sound meter app, at set times and places |
Does the fix work?
Monitoring matters most when someone tries to minimize an impact. A ward bans burning rubbish; a school plants a hedge; a city switches its buses to electricity. Did it work? The obvious test is to measure before and after. But the weather keeps changing the air, so a before-and-after test alone can fool you: a rainy week after the ban would make any ban look wonderful.
The answer is a control: measure, at the same times, a similar place where nothing changed. If the air got cleaner by the same amount there too, the weather did it, not the ban. The fix’s effect is the change at the fixed place minus the change at the control place.
A fix can also be designed from what monitoring shows. In the valley’s winter, the morning air outdoors is often three times dirtier than at 2 pm. A school that keeps its windows closed in the early morning and airs its rooms in the early afternoon lets in fresh air when it is cleanest, at no cost.
Judging a big fix, like rebuilding the valley’s brick kilns after the 2015 earthquake, needs more: measurements at the chimneys, many kilns of each kind, the cost and the side effects. That is the topic Does the Fix Actually Work? in Going Further, Grades 9–12.
A city bans old diesel trucks in January. In February its monitors read 20% less PM2.5. Why can’t you yet say that the ban cut PM2.5 by 20%?
Pick an answer to see why.
Measure it yourself
Questions
Which is the best way to find out whether a new rule against burning rubbish has made your ward’s air cleaner?
Pick an answer to see why.
Explain why Kathmandu’s PM2.5 is often three times higher at 9 am than at 2 pm on the same winter day, although the traffic is about as heavy at both times.
Answer
On winter nights the ground cools quickly and chills the air above it. Cold, dense air collects on the valley floor under warmer air: a temperature inversion. The air below doesn’t mix with the air above, so the smoke and dust from the evening and early morning stay trapped in a shallow layer, only about 150 m deep, and their concentration builds up to a peak in the morning. By early afternoon the Sun has warmed the ground, rising warm air has mixed the pollution through a layer several hundred meters deep, and westerly winds blow some of it out of the valley. The same amount of pollution in several times as much air gives a much lower concentration.
A sampler draws 16.7 liters of air a minute through a filter for 24 hours, and the filter gains 1.10 mg.
- a.What was the PM2.5 concentration?
- b.Was the air within Nepal’s 24-hour standard? Within the WHO guideline?
- c.Use the AQI table to find the AQI.
Answer
- a.Volume = 16.7 × 1,440 = 24,048 L = 24.0 m³. Concentration = 1,100 µg ÷ 24.0 m³ = 46 µg/m³ (45.8).
- b.It is above Nepal’s standard of 40 µg/m³, and about three times the WHO guideline of 15 µg/m³.
- c.46 µg/m³ is in the band 35.5 to 55.4 (AQI 101–150).
AQI 126, unhealthy for sensitive groups.
A low-cost sensor on a school wall reads 95 µg/m³ on a foggy, humid morning, while the nearest station reads 60 µg/m³. Give two reasons why they might differ, and say how you would find out which reason is right.
Answer
- a.Humidity: in humid air, particles soak up water and swell, so an optical sensor sees bigger particles and overestimates the mass, while the station measures the dry particles.
- b.Place: the school wall may really have dirtier air than the station, for example if it is beside a road, a kiln or a rubbish fire.
To find out: take the sensor to the station and run it beside the reference monitor for a week or two, including dry and humid days. If it reads high only when it is humid, humidity is the reason, and the comparison gives you a correction. If it agrees with the station there but reads higher at the school, the school’s air really is dirtier.
Your school wants to know whether a row of trees between the playground and the road makes the playground air cleaner. Design a monitoring plan: give the question, what you would measure and with what, where, when and for how long, what you would compare with, and how you would decide whether the answer is clear.
Answer
A full-marks plan includes:
- Question: Is the PM2.5 lower behind the trees than at the same distance from the road where there are no trees?
- Measure: PM2.5, in µg/m³, with two identical low-cost sensors, checked side by side first for a few days and corrected if one reads higher.
- Where: one sensor behind the row of trees and one at the same distance from the same road where there are no trees (the control), both at about 1.5 m, the height children breathe.
- When and how long: every minute, for at least two to three weeks, in the same season, at the same times; then compare hourly averages, especially during school hours.
- Compare: the two places at the same times, so that the weather and the traffic are the same for both. Then swap the two sensors and measure again, so that a difference between the sensors can’t fool you.
- Decide: if the place behind the trees is lower on most days, by more than the difference you found between the sensors side by side, the trees help. If it is sometimes higher and sometimes lower, you can’t say yet; measure for longer. (The answer may be no: trees can also slow the wind and trap fumes on the road side.)
In January a city switched all its buses to electricity. A newspaper reports that the city’s PM2.5 was 30% lower in April than in January, and says the electric buses cut pollution by 30%. Explain what is wrong with the claim, and how you would estimate the buses’ real effect.
Answer
January and April have different weather. In a city like Kathmandu, January has inversions, fires for warmth and kilns working, and April is warmer with deeper mixing, so PM2.5 would probably have fallen from January to April even with no change to the buses. The 30% fall mixes the season’s effect with the buses’ effect.
Better: compare April this year with April of earlier years (the same season), allowing for how dry or windy each year was; or compare the change in this city with the change over the same months in a similar city that didn’t change its buses (a control). Measuring at the roadside, where buses pass, and in places far from bus routes would also show how much of the change is near the buses.
Where to go next
- Does the Fix Actually Work? (Going Further, Grades 9–12) How the valley’s brick kilns were rebuilt after the 2015 earthquake, and how to judge whether the new design really cuts the smoke: per what, compared with what, and at what cost.
- What Happens When There Are More of Us, Each Using More? More people, each using more water, land and energy: what it does to the planet, and what can change it.
- Is the Earth Really Getting Warmer? Measuring carbon dioxide and temperature over decades, and how we know people are the cause.