
It is a January morning in Bhaktapur. The fog hasn’t lifted by ten o’clock, your fingers are numb on the way to school, and someone at the tea shop laughs: “Global warming? I’m freezing!” Your grandmother, on the other hand, says the winters were much colder when she was a girl, and the snow on the hills came lower.
Who is right? A cold morning is one day in one town. A grandmother’s memory is one person’s, many years ago. Neither can tell you what the whole Earth is doing. In Grade 8 you read that the Earth is getting warmer and that people are causing it. But a scientist doesn’t ask you to take that on trust. This topic is about the evidence: what has been measured, how, and how scientists can tell who, or what, is to blame. Think of it as a detective story, with suspects, clues and fingerprints, and with you asking the questions.
One cold day proves nothing
You met the greenhouse effect in Grade 8: gases in the air such as carbon dioxide absorb the heat the Earth gives out and send part of it back down, keeping the Earth about 33 °C warmer than it would otherwise be Grade 8: The natural greenhouse effect. More of those gases trap more heat, and the Earth’s average temperature rises: global warming Grade 8: Global warming.
Notice the word average. The weather changes from hour to hour and day to day: a cold wave in the Terai, a hot week in Pokhara. Climate is the weather of a place averaged over many years, usually 30. Global warming is about the climate of the whole Earth: its temperature averaged over every place, land and sea, and over a whole year. Even in the warmest year ever measured, there were cold days and cold places. A single cold morning tells you about the weather, not the climate.
So the question “Is the Earth getting warmer?” can only be answered with measurements from all over the world, kept up for a long time. Luckily, people have been writing down the temperature for more than 170 years.
Which of these is evidence about the climate of the whole Earth?
Pick an answer to see why.
The world’s thermometer
Every day, more than 10,000 weather stations on land write down the temperature, some of them since the 1850s. Nepal’s Department of Hydrology and Meteorology has stations from the Terai to the high mountains. At sea, ships have measured the water’s temperature since the 1850s (at first by hauling up a bucket of sea water), and today thousands of floating buoys send their readings by satellite.
Several teams of scientists, in Britain, the USA and Japan, each turn these millions of readings into one number for each year. They work separately, use different methods, and get results that agree to within about a tenth of a degree. Each number says how much warmer or cooler that year was than the average of the years 1850–1900, before factories, cars and power stations had burned much coal, oil and gas. (Why scientists compare each station with its own usual temperature, and how they deal with the stations in growing towns, is in the 9–12 topic What Will the Climate Be Like When You Are Grown Up?.)
Look at Figure 31.1. Until about 1910 the years are as often a little cooler than the zero line as warmer. Then the bars grow. Not a single year since 1929 has been cooler than the 1850–1900 average, and the eleven warmest years ever measured are the last eleven, 2015 to 2025 (as of 2026). 2024 was the warmest year on record, about 1.5 °C warmer than 1850–1900.
A degree may not sound much. You can feel more than that walking from the sun into the shade. But this is the average of the whole Earth, every day and night, year round. In the coldest part of the last ice age, about 20,000 years ago, when ice sheets covered much of North America and Europe, the whole Earth was only about 6 °C colder than in 1850–1900.
Other clues that agree
A thermometer record could have mistakes in it: a station moved, a town grew round it, a ship’s bucket dried out on deck. So scientists check it against things measured in completely different ways. They all tell the same story.
| Clue | How it is measured | What it shows |
|---|---|---|
| Glaciers | stakes in the ice, photos, satellite maps | almost every glacier in the world is shrinking; in the Hindu Kush Himalaya, ice was lost 65% faster in 2011–2020 than in 2000–2010 |
| Sea level | tide gauges in harbors, and satellites since 1993 | up about 20 cm since 1900, as sea water warms and expands and melted ice runs into the sea |
| Arctic sea ice | satellites since 1979 | the ice left at the end of each summer has shrunk by more than a third |
| Heat in the sea | thousands of floating robots that dive to 2 km and come up again | the sea is gaining heat year after year: it has taken up about 90% of the extra heat |
Why does it matter that glaciers, sea level and sea ice all show the same change as the thermometers?
Pick an answer to see why.
What has changed in the air
The world is warmer. The next question a detective asks is: what has changed? In Grade 8 you read that the greenhouse gases in the air have increased. How do we know?
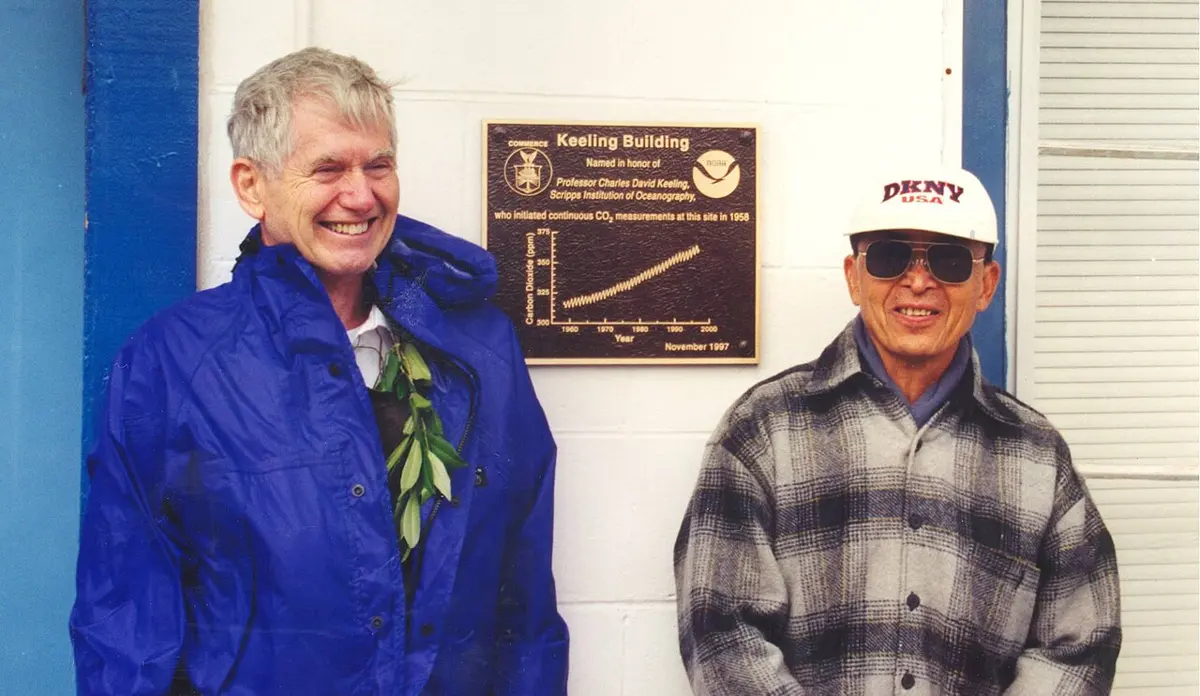
The amount of carbon dioxide in the air is tiny, so it is counted in parts per million (ppm): how many molecules out of every million molecules of air. In 1958 there were about 315. Today there are more than 425: about 0.04% of the air. (How such a small amount can matter so much is a question at the end of this topic.)
Why the yearly zigzag? Most of the world’s land, and most of its forests, are in the northern half of the Earth. From spring to autumn, its plants grow, and take in carbon dioxide for photosynthesis faster than living things give it out. In winter, leaves fall and rot, plants rest, and the carbon dioxide builds up again. The air’s carbon dioxide goes down and up once a year, as if the whole northern half of the world were breathing. The climb underneath has nothing to do with the seasons: it comes from something adding carbon dioxide year after year.
Older air, trapped in ice
Keeling’s record starts in 1958. To go further back, scientists drill into the ice sheet of Antarctica. Snow that fell long ago was buried and pressed into ice, and it trapped tiny bubbles of the air of its time. Cores of this ice, more than 3 km long, hold air that is 800,000 years old. The bubbles show that for thousands of years before about 1800 the carbon dioxide stayed close to 280 ppm, and in all those 800,000 years it never went above about 300 ppm. Today it is about half as much again as before factories. (The ice cores, and how carbon dioxide rose and fell with the ice ages, are in the 9–12 topic Why Has the Climate Changed Before?.)
Methane (CH₄), the second most important greenhouse gas that people add, has risen even more. It comes from rice paddies, from the stomachs of cows, buffaloes and goats, from rotting rubbish dumps, and from leaks in coal mines and gas pipes. From about 730 parts per billion (ppb) in 1750, it has risen to more than 1,930 ppb (as of 2025): more than two and a half times as much.
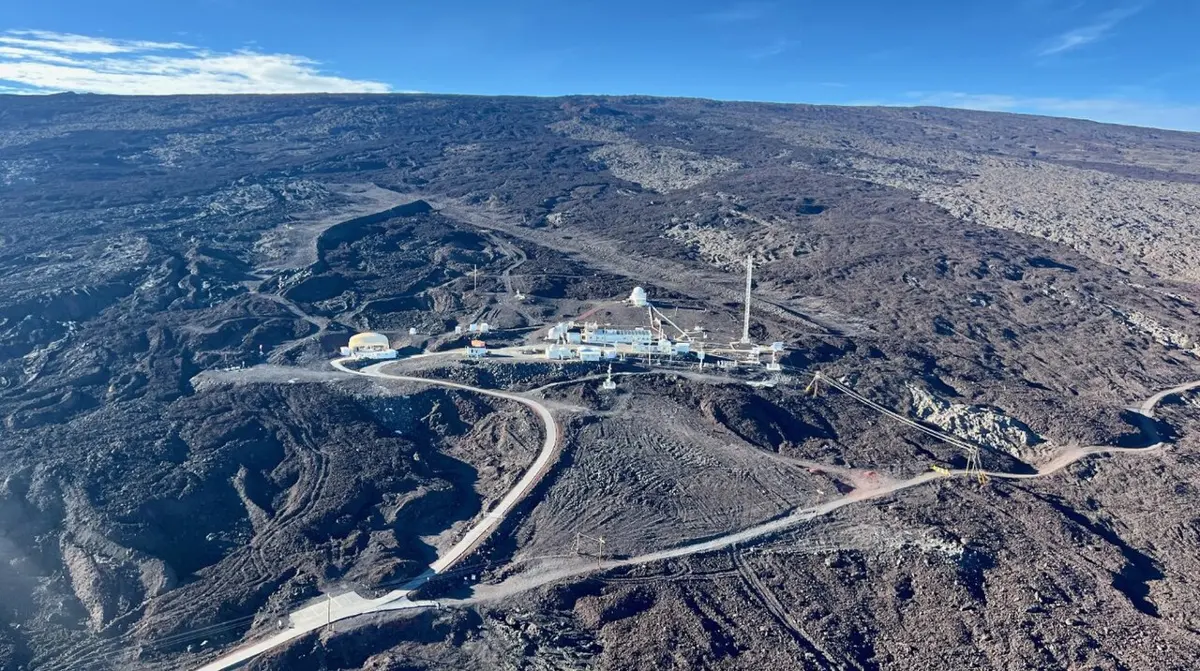
Why does carbon dioxide at Mauna Loa rise and fall every year?
Pick an answer to see why.
Where is the extra carbon dioxide coming from?
You know from Grade 8 and Grade 10 that people add carbon dioxide by burning coal, oil and gas, and by cutting down forests Grade 10: Causes of climate change. Every bus, motorbike, brick kiln and gas stove in Nepal burns a fossil fuel, and every liter of petrol burned gives off about 2.3 kg of carbon dioxide. But a good detective asks: is that really enough to explain the rise? And couldn’t the carbon dioxide be coming from somewhere else, like volcanoes, or the sea?
Scientists add up what is released each year all over the world, from the coal, oil and gas sold, the cement made, and the forests cleared seen from satellites.
Next: is what people release enough to explain the rise? Scientists know that about 7.8 billion tonnes of carbon dioxide added to the air raises its amount by 1 ppm.
People release about twice as much carbon dioxide each year as the rise in the air needs. Which statement does this support?
Pick an answer to see why.
Line up the suspects
Now for the main question: what has caused the warming? A good detective lists every suspect, not just the obvious one. For the Earth’s temperature there are natural suspects and human ones.
- The Sun. If the Sun got brighter, the Earth would warm. Its brightness has been measured from satellites, above the air, since 1978; before that, it is worked out from the number of sunspots, counted since the 1600s. It rises and falls by about 0.1% over the Sun’s 11-year cycle of sunspots.
- Volcanoes. A big eruption throws sulphur gas more than 20 km up, where it turns into a haze of tiny droplets that reflect sunlight. When Mount Pinatubo in the Philippines erupted in June 1991, the whole Earth cooled by about 0.4 °C over the next year. Then the droplets fell out of the air, and within two or three years the cooling was gone.
- Natural ups and downs. Every few years the Pacific Ocean warms (an El Niño) or cools (a La Niña), and for a year or so the whole world is a little warmer or cooler. This moves heat between the sea and the air. It can’t warm both at once, but both are warming.
- Greenhouse gases from people: carbon dioxide, methane, nitrous oxide (from fertilizers) and others, rising, as you have seen.
- Haze from pollution. Smoke, dust and the tiny droplets made from the sulphur in coal and diesel reflect sunlight, as a volcano’s haze does, and cool the Earth. You can see this haze over the Kathmandu Valley in winter.
To compare the suspects, scientists work out how hard each one pushes on the Earth’s temperature: how much extra heat, in watts, it adds to (or takes from) each square meter of the Earth, on average. A push up warms the Earth; a push down cools it. Then they ask: which push has changed in the way the temperature has?
What did you find? The Sun’s push is small, and has gone slightly down since the 1960s, while the Earth warmed by a whole degree. If the Sun were to blame, the temperature would have followed it down. Volcanoes push hard but briefly: they explain the dips after Krakatoa, Agung and Pinatubo, not a climb lasting fifty years. (Their push is a little weaker now than in the 1960s, because Agung erupted in 1963, and since Pinatubo no eruption has thrown as much sulphur so high. That explains a small part of the warming, no more.) Only the greenhouse gases’ push has climbed year after year, faster and faster, as the temperature has. And the pollution haze has been pushing the other way, hiding part of the warming: that is one reason the world warmed little between about 1950 and 1975, when the haze was growing fast.
Measurements of the Sun show that it has not got brighter since the 1960s, while the Earth warmed by about 1 °C. What can you conclude?
Pick an answer to see why.
Fingerprints in the sky
Detectives look for a clue that only one suspect could have left. Climate scientists have one too, high up in the air.
The air has layers. The bottom one, up to about 12 km, is where clouds, rain and weather happen: here, the higher you go, the colder it gets, which is why the Himalaya has snow. Above it is the stratosphere, the high air, stretching to about 50 km up, very thin and dry.
Now think about the two suspects. If the Sun were brighter, more sunlight would pour through all the layers, and the whole air, top to bottom, would warm. Greenhouse gases work differently. They hold heat in the lower air, so less of the Earth’s heat reaches the high air from below. And in the thin high air, extra carbon dioxide gives out more heat to space than it catches. So more greenhouse gases should warm the lower air and cool the high air.
This was predicted in 1967 by the Japanese-American scientist Syukuro Manabe and his colleague Richard Wetherald, with one of the first computer models of the climate, before anyone could measure it. Satellites have measured the high air’s temperature since 1979. They show exactly what Manabe predicted: the lower air is warming, while the air 25 to 50 km up cooled by 1 to 2 °C between 1986 and 2022. A brighter Sun couldn’t do that. In 2021, Manabe shared the Nobel Prize in Physics for his work.
Satellites find the lower air warming and the high air (the stratosphere) cooling. Why is this strong evidence against the Sun as the cause?
Pick an answer to see why.
Asking good questions
Science asks you to do more than learn the answer: to ask questions that test the evidence. A good skeptic doesn’t refuse to believe anything; they ask “How do you know?” and then look at the answer. Here are questions people often ask about global warming, and where the evidence stands.
| A skeptic asks | What would answer it | What the evidence shows |
|---|---|---|
| Aren’t the thermometers just in towns that have grown hotter? | Compare with country stations and with the sea | Country stations and the sea, which has no towns, show the same warming (how) |
| Could it be the Sun? | Measure the Sun; look at the high air | The Sun hasn’t got brighter since the 1960s; the high air is cooling, not warming |
| Don’t volcanoes give out more carbon dioxide than people? | Add up the volcanoes’ gas | Volcanoes give out about a hundredth as much as people |
| The climate changed before people existed, in the ice ages. Isn’t this natural too? | Find what caused the past changes, and whether they are acting now | The ice ages came from slow changes in the Earth’s orbit over tens of thousands of years, much slower than today’s warming (the past) |
| How can 0.04% of the air matter? | Measure how strongly carbon dioxide absorbs heat | A little of a strong absorber does a lot, like a few drops of ink in a glass of water. Without the greenhouse gases the Earth would be about −18 °C |
| Didn’t the warming stop for a while? | Look at many years, not a few | Short stretches wobble; the 30-year trend has kept rising (the “pause”) |
Questions
In one Nepali town, the winter of one year was colder than any for 20 years. What does this tell you about global warming?
Pick an answer to see why.
Which of these is evidence that the extra carbon dioxide in the air comes from burning fossil fuels?
Pick an answer to see why.
The average carbon dioxide at Mauna Loa was 338.76 ppm in 1980 and 414.21 ppm in 2020. Work out a. the rise, b. the average rise per year, and c. how many ppm it would reach by 2050 if it kept rising at the 2015–2025 rate of 2.6 ppm a year from 427 ppm in 2025.
Answer
- a.Rise = 414.21 − 338.76 = 75.45 ppm.
- b.Average rise = 75.45 ppm ÷ 40 years = 1.89 ppm per year.
- c.From 2025 to 2050 is 25 years. 427 + 2.6 × 25 = 427 + 65 = about 492 ppm, if nothing changed. (It would be higher if the rise kept speeding up, and lower if people burned less fuel.)
Write three questions you could ask to find out whether the Sun is causing today’s warming. For each, say what evidence would answer it.
Answer
- Has the Sun got brighter while the Earth warmed? Evidence: satellite measurements of the Sun’s brightness since 1978, and sunspot counts before that. They show no rise since the 1960s.
- Does the pattern of warming match a brighter Sun? Evidence: the temperature of the high air (stratosphere), from satellites and weather balloons. A brighter Sun would warm it; it is cooling.
- Did the Earth warm and cool with the Sun’s 11-year cycle in the past? Evidence: the temperature record against sunspot counts. The cycle shows only as a wobble of about a tenth of a degree, far smaller than the warming.
Another good question: did the Sun’s changes explain past warming, such as in the early 1900s?
A classmate says: “Volcanoes put out much more carbon dioxide than people, so the rise must be natural.” Use numbers to reply.
Answer
All the world’s volcanoes, on land and under the sea, give out about 0.3 billion tonnes of carbon dioxide a year (estimates range from 0.13 to 0.44 billion tonnes). People release about 42 billion tonnes a year (38.1 from fossil fuels and cement, 4.1 from cutting down forests, in 2025). That is about 140 times as much as volcanoes, and at least about 100 times even with the highest estimate. A huge eruption such as Mount St. Helens in 1980 gave out about as much as people do in two hours. And the extra carbon dioxide has the fingerprint of fossil fuels, not volcanoes. So the rise is not natural.
Why do scientists check the thermometer record against glaciers, sea level and sea ice? Give one example of a mistake the thermometers could make that the glaciers could not.
Answer
Every kind of measurement can have its own mistakes. Clues measured in completely different ways can’t all share the same mistake, so if they agree, the conclusion is much more certain. For example, if a town grows round a weather station, the concrete, roads and engines warm the air there, and the station reads warmer although the climate hasn’t changed. That wouldn’t make a glacier in the Himalaya shrink, or the sea rise in a harbor. Yet glaciers are shrinking and the sea is rising, as the thermometers say.
Look at Figure 31.1. The world warmed between about 1910 and 1945, then hardly warmed from about 1950 to 1975, then warmed fast. Using the suspects in this topic, suggest why.
Answer
From 1910 to 1945, the greenhouse gases were rising slowly, and there were also natural pushes: the Sun brightened a little, and there were few big volcanic eruptions. From 1950 to 1975, factories and power stations grew fast and burned coal and oil with a lot of sulphur, so the cooling haze of pollution grew fast too, roughly canceling the gases’ warming; the eruption of Agung in 1963 cooled the world for a while as well. From the 1970s, the gases kept rising faster and faster, while the haze stopped growing, and since about 2010 has weakened as many countries cleaned up their air, so the warming of the gases showed.
Explain how the temperature of the high air (the stratosphere) helps scientists tell whether greenhouse gases or the Sun is causing the warming.
Answer
A brighter Sun would send more energy through all the layers of the air, so the high air and the lower air would both warm. More greenhouse gases keep more heat in the lower air, so less reaches the high air from below, and in the thin high air the extra carbon dioxide gives out more heat to space. So greenhouse gases warm the lower air and cool the high air. Satellites show the lower air warming and the air 25–50 km up cooling, by 1 to 2 °C between 1986 and 2022. That is the pattern greenhouse gases make, not the Sun’s.
Where to go next
- What Will the Climate Be Like When You Are Grown Up? From the 9–12 book: how fast the world is warming, what is happening to Nepal’s glaciers, and how climate models forecast the future.
- Why Has the Climate Changed Before? From the 9–12 book: the Earth’s energy balance, and what caused the ice ages.
- Can We Tell When Disaster Will Strike? Floods, landslides and earthquakes: what their records can and can’t forecast, and why a warmer world makes the past a poorer guide.