
The ECG: reading the heart’s electricity
Nobel Prize in Physiology or Medicine, 1924: Willem Einthoven
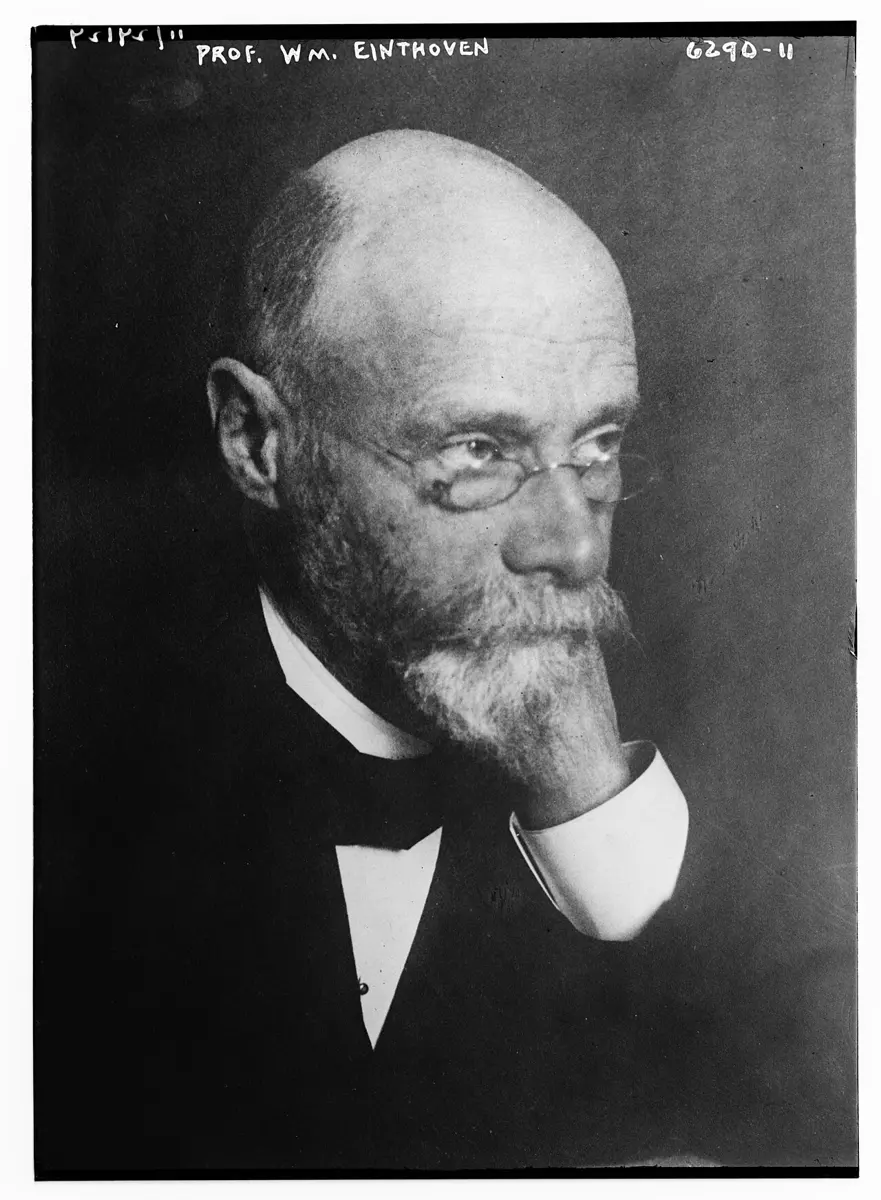
Willem Einthoven
1860–1927, born in Java (now Indonesia)
A doctor whose real gift was for physics. He built his own instruments, and spent years making them better.
Photo: Bain News Service, publisher, Public domain
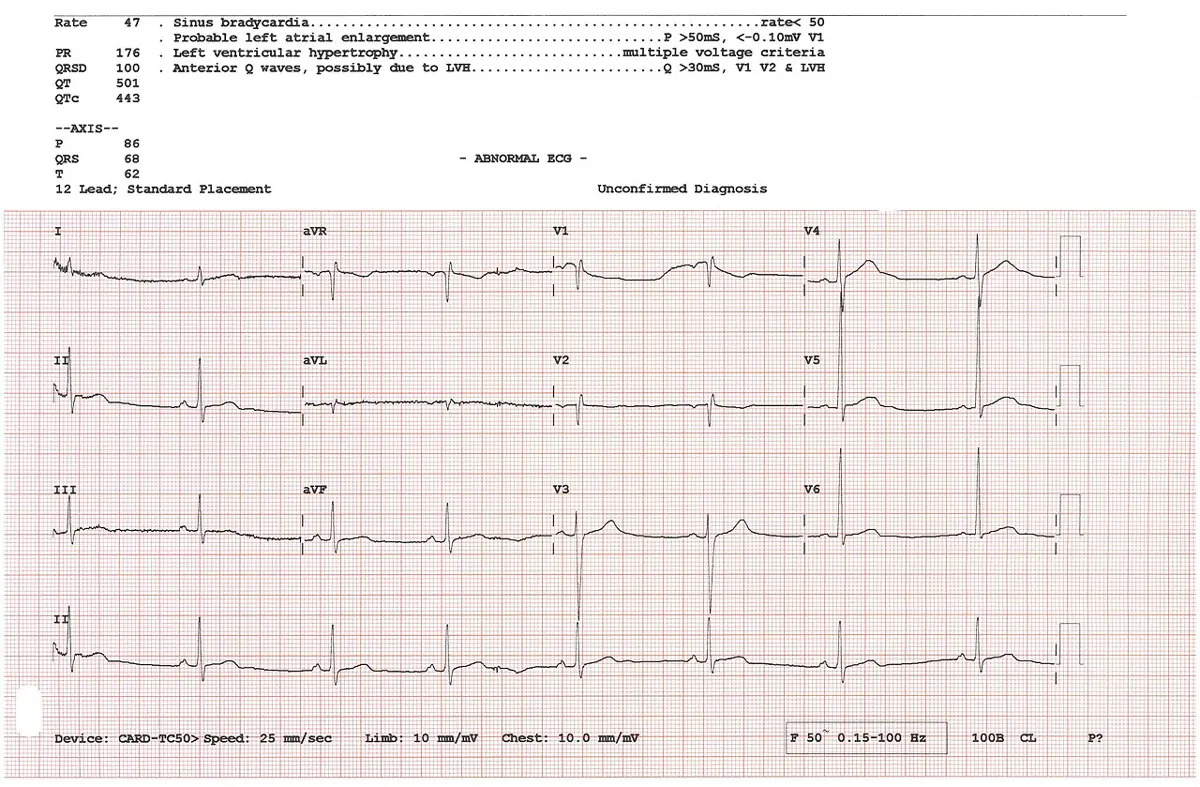
If you go to a doctor with chest pain, one of the first things they do is stick small pads on your chest, arms and legs and print out a wavy line on squared paper: a line that runs along, jumps up into a sharp spike, and runs along again, once for every heartbeat. It takes a few minutes, it doesn’t hurt, and it tells the doctor a great deal about your heart.
That line is an electrocardiogram, or ECG for short (“electro” for electricity, “cardio” for heart, “gram” for something written down). In 1924 the Nobel Prize in Physiology or Medicine went to the Dutch scientist who first recorded it properly and showed what it means: Willem Einthoven.
The problem: a heart nobody could see working
Before 1900, a doctor could feel the pulse at the wrist and listen to the heart through a stethoscope, and that was almost all. If the heartbeat was uneven, or part of the heart muscle was damaged, it was very hard to say what was wrong.
Scientists did know one useful thing. Every muscle in your body makes a tiny electric current when it contracts, and the heart is a muscle. In the 1850s, two scientists in Germany showed that a frog’s beating heart makes electricity. In 1887 an English physiologist, Augustus Waller, recorded the electricity of a person’s heart for the first time, and showed that it could be picked up even from the hands and feet. Wires from the hands to a sensitive instrument made it move in time with the heartbeat. His dog, a bulldog called Jimmy, often helped at his lectures by standing with his paws in jars of salt water.
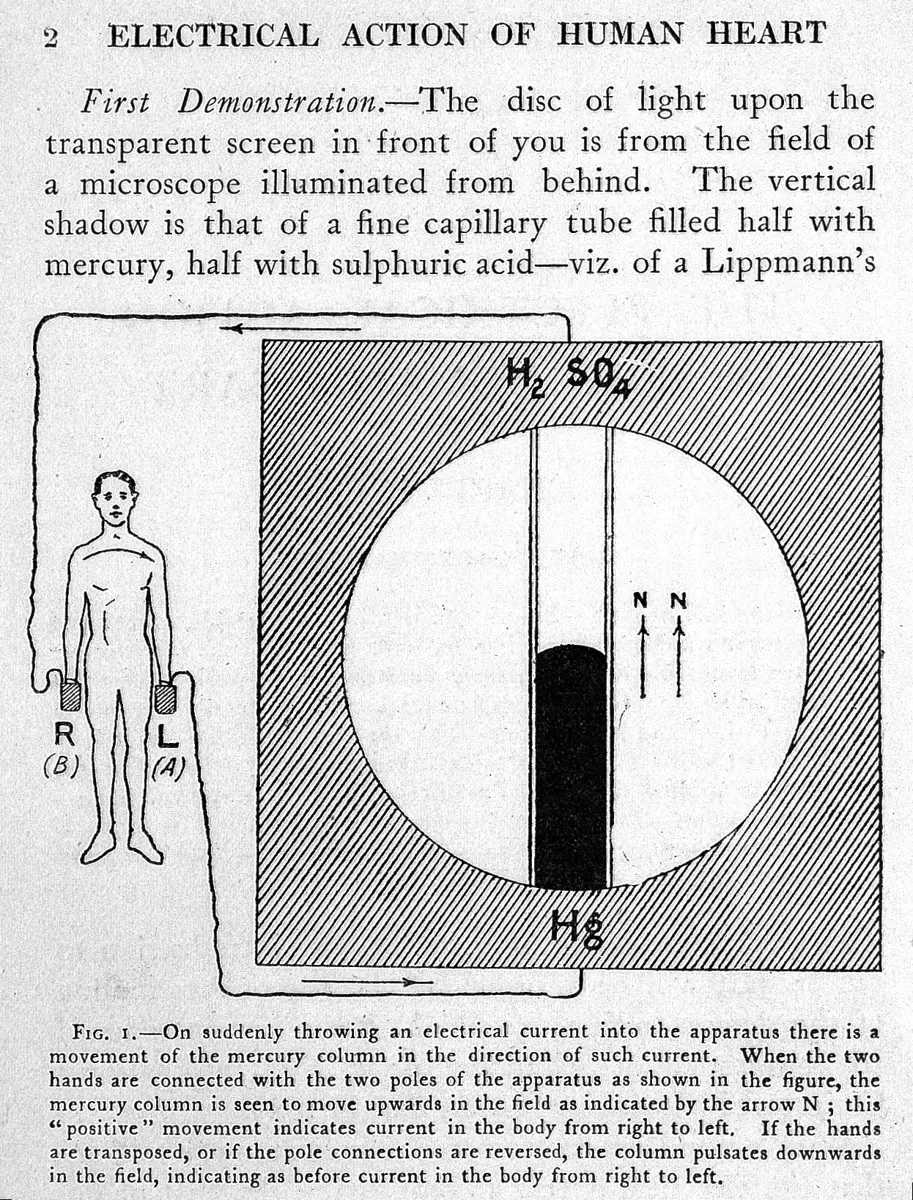
But Waller’s instrument had a big weakness. The mercury in its tube was slow. It could not keep up with the quick changes in the heart’s electricity, so the curves it drew were smudged and rounded. Waller himself doubted that his heart curves would ever be much use in hospitals.
How the heart makes electricity
Your heart has four chambers: two auricles (also called atria) at the top, and two ventricles below Grade 10: Inside the heart. It is made of cardiac muscle, a kind of muscle found only in the heart, which never tires Grade 9: Cardiac muscle. Every heartbeat starts with an electrical signal:
- A small patch of special cells in the wall of the right auricle, the heart’s natural pacemaker, fires a signal about 60 to 100 times a minute when you are resting.
- The signal spreads across both auricles, and they squeeze, pushing blood down into the ventricles.
- The signal is held up for a moment, about a tenth of a second, at the border between the auricles and the ventricles. This gives the ventricles time to fill.
- Then the signal races down special conducting fibers into the walls of both ventricles, and they squeeze hard, pushing blood out to the lungs and the body.
- The muscle cells recover, and the heart waits for the next signal.
As the signal spreads, one part of the heart is electrically different from another part, so there is a small voltage (a push of electricity) between them. Your body is full of salty water, which conducts electricity, so a tiny share of that voltage reaches your skin, even at your wrists and ankles. It is very small: about 1 millivolt (one thousandth of a volt). A single torch cell gives 1.5 volts, which is 1,500 times more.
How can an ECG machine pick up the heart’s signals from pads on your wrists, when your heart is in your chest?
Pick an answer to see why.
Why it was hard
The heart’s signal is both tiny (thousandths of a volt) and fast (its sharpest part lasts less than a tenth of a second). The instruments of the time could not manage both at once. A galvanometer measures current with a coil of wire hung between the poles of a magnet: current in the coil makes it turn. With a weak spring it is sensitive but swings slowly; with a stiff spring it is fast, but a tiny current hardly moves it. Waller’s mercury tube was sensitive but slow.
Einthoven first tried to get round this with mathematics. From 1891 he studied the capillary electrometer very carefully, and worked out how much it lagged behind the real signal. In 1894 and 1895 he used this to correct its curves, point by point, and drew the true shape of the heart’s signal for the first time. But correcting one curve took hours: useless for a doctor with a patient waiting. He needed an instrument that drew the true curve by itself.
What he did, step by step
Einthoven in Leiden
Willem Einthoven was born in 1860 in Semarang, on the island of Java, then a Dutch colony. After his father died, the family moved to the Netherlands. He studied medicine in Utrecht and, in 1886, at the age of 25, became professor of physiology at the University of Leiden, where he stayed for the rest of his life.
- 1895, the names of the waves. On his corrected curves, Einthoven labeled the bumps and spikes of a heartbeat with the letters P, Q, R, S and T. Nobody knows for sure why he chose those letters (he had already used A, B, C and D for the uncorrected curves). Most likely he followed an old habit of mathematicians, going back to Descartes, of naming the points on a curve from P onwards.
- 1901, the string galvanometer. Einthoven’s big idea was to throw away the coil, the mirror and the spring. Instead, he stretched a single string between the poles of a powerful electromagnet. The string was a very fine thread of quartz (glass-like rock), coated with a thin layer of silver so that it conducts electricity. Most were only 2 or 3 thousandths of a millimeter thick, about thirty times thinner than a hair. When a current flows through a wire in a magnetic field, the magnet pushes the wire sideways Grade 10: The motor effect. A string that thin weighs almost nothing, so even the heart’s tiny current moved it, and moved it fast.
- Making it visible. A microscope threw a magnified shadow of the string onto a photographic plate moving steadily behind a slit. As the shadow moved, it drew the heart’s trace.
- Three years of work. The idea was simple, but turning it into a precise instrument took about three years. Einthoven first described it in 1901, and in 1903 published the first records of human hearts made with it. When he compared its curves with his old, corrected capillary-electrometer curves, they matched. That proved both were showing the heart’s real signal.
The first long-distance ECG (1905)
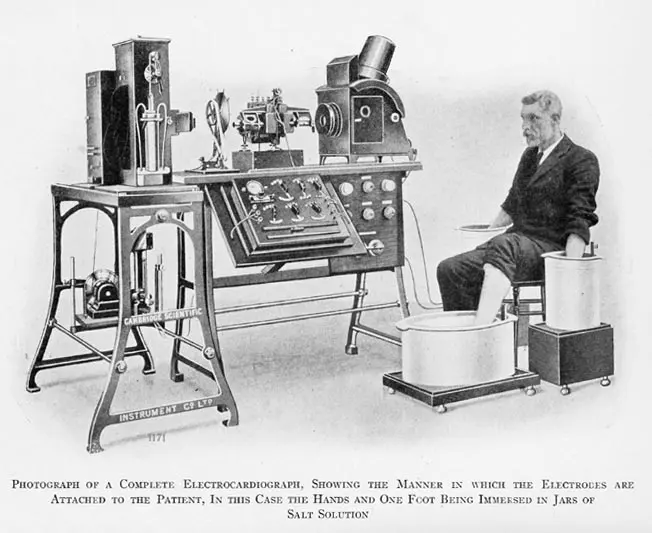
Einthoven’s galvanometer was a giant: it weighed about 270 kg, its electromagnets had to be cooled with water, and it took five people to work it. It could not be carried to the patients. But Leiden’s hospital was about 1.5 km from his laboratory.
- A telephone wire. Einthoven connected the hospital to the laboratory with a telephone cable. Patients in the hospital put their hands and a foot into jars or buckets of salt water, which acted as the electrical contacts. Their heart’s tiny current traveled down the wire to the string galvanometer in the laboratory.
- 22 March 1905, the first record. The first ECG recorded this way was taken on 22 March 1905. Einthoven called these records telecardiograms: heart writing from a distance.
- 1906, diseases show up. In a paper called Le télécardiogramme (1906), he showed that different heart diseases give different shapes: a thickened ventricle, a damaged heart muscle, or a heart whose signal was blocked between the auricles and ventricles.
Why did Einthoven’s string galvanometer record the heart’s signal so much better than Waller’s mercury tube?
Pick an answer to see why.
Three leads and a triangle (1908–1913)
Einthoven noticed that the shape of the ECG changes depending on where the contacts are placed. In 1908 he fixed three standard ways of connecting a patient, called leads:
- Lead I: right arm and left arm;
- Lead II: right arm and left leg;
- Lead III: left arm and left leg.
Each lead looks at the heart from a different side, like three people photographing the same building from three corners. In 1913 he showed how to put the three together, with the heart in the middle of a triangle (Einthoven’s triangle), to work out which way the heart’s signal points at each moment. They always obey a simple rule: lead I + lead III = lead II.
From the laboratory to every hospital
Einthoven’s instrument was too big and too difficult for doctors to build. Within a few years, instrument makers in Germany and in England were selling simpler versions, called electrocardiographs (ECG machines). In London, a young doctor named Thomas Lewis used one to study irregular heartbeats in his patients, and he showed what Einthoven’s waves meant for each disease.
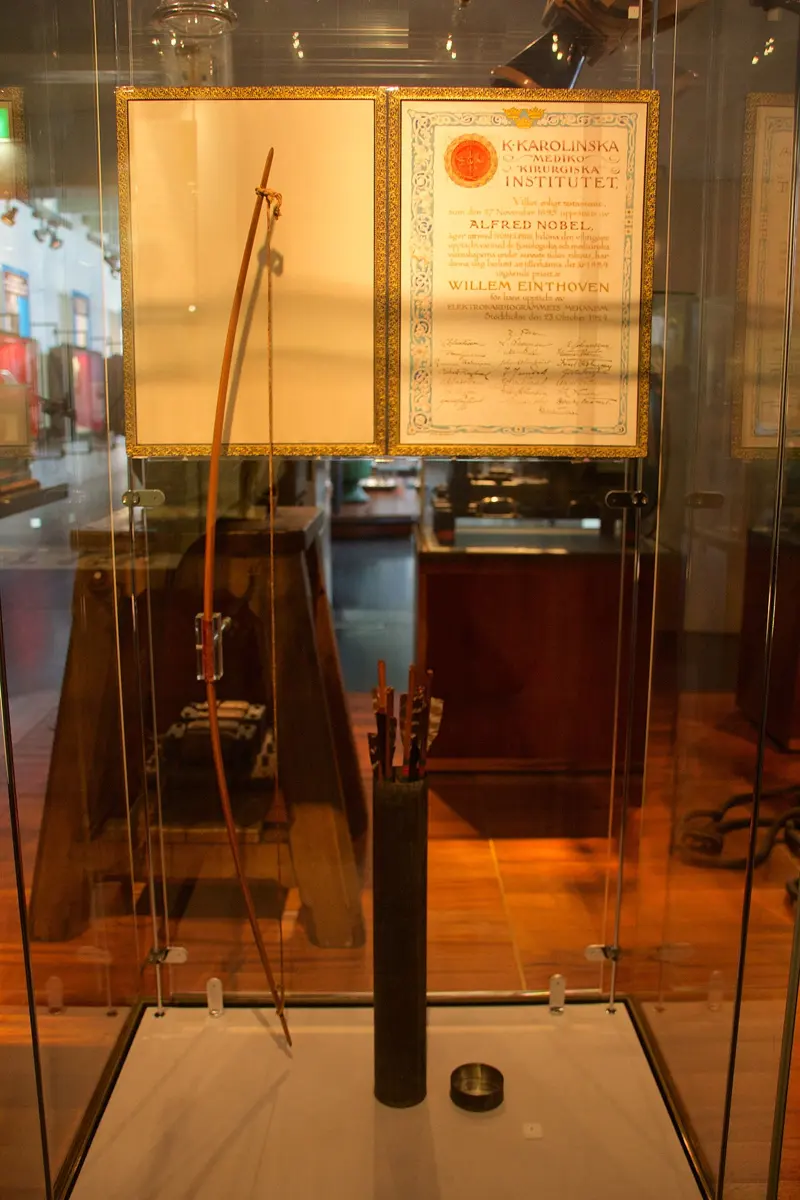
When the prize was announced, on 23 October 1924, Einthoven was on a lecture tour in the United States. In his Nobel lecture, in December 1925, he said he doubted he would be standing there without Thomas Lewis’s work.
How it works now: reading an ECG
A modern ECG machine has no string and no magnet. Small sticky electrodes pick up the voltage on the skin, electronic amplifiers make it thousands of times bigger, and a computer prints it or shows it on a screen. But it still records Einthoven’s three leads, and it still names the waves with his letters.
ECG paper is covered in small squares 1 mm wide, with a thicker line every 5 mm. The paper usually moves at 25 mm every second, so:
- one small square across is 0.04 seconds;
- one big square across is 0.2 seconds;
- 10 mm up is 1 millivolt.
Because the paper always moves at the same speed, the doctor can measure time with the squares. If there are about four big squares from one R spike to the next, the beats are 4 × 0.2 = 0.8 seconds apart, so the heart is beating 60 ÷ 0.8 = 75 times a minute.
On an ECG printed at 25 mm per second, the R spikes are 5 big squares apart. How fast is the heart beating?
Pick an answer to see why.
Today a standard hospital ECG uses 12 leads: Einthoven’s three, three more worked out from the same arm and leg pads, and six from pads placed across the chest. Each looks at the heart from a different angle, so a doctor can tell which part of the heart is damaged.
In your life today
- Heart attacks. When a blocked blood vessel starves part of the heart muscle of oxygen, the shape of the ECG changes, often within minutes Grade 10: Heart attack: diagnosis and treatment. An ECG is usually the first test for anyone with chest pain, in every hospital, including in Nepal.
- Uneven heartbeats. An ECG shows whether the heart is beating too fast, too slow or unevenly, and where the problem starts.
- Monitors. The beeping screen beside a bed in an intensive care unit shows a live ECG.
- On your wrist. Some smartwatches can now record a simple one-lead ECG, like Einthoven’s lead I, between the watch on one wrist and a finger of the other hand.
What came next
- More leads. In the 1930s and 1940s, more leads were added, on the chest and from the limbs, giving the 12-lead ECG used today.
- The string galvanometer’s end. From the 1920s, electronic amplifiers began to replace Einthoven’s string, and by the middle of the 20th century the string had disappeared from hospitals. His letters and his three leads stayed.
An open question: computers can now read ECGs, and some researchers report that computer programs can spot signs in an ECG that even expert doctors don’t see. How far such programs can be trusted with a patient’s life, and how doctors should use them, is still being worked out.
In your science books
- Grade 9: cardiac muscle, the heart’s own kind of muscle.
- Grade 10: the heart and one heartbeat, step by step, heartbeat and pulse rate, diagnosing a heart attack, and the motor effect, the push on a current in a magnetic field that moved Einthoven’s string.
Learn more
- The prize at nobelprize.org: The Nobel Prize in Physiology or Medicine 1924, with the presentation speech that explains his work.
- Einthoven’s own Nobel lecture, “The string galvanometer and the measurement of the action currents of the heart”.
The official reason
The prize was given “for his discovery of the mechanism of the electrocardiogram.”