
Burning one 14.2 kg cylinder of LPG, the gas your family cooks dal bhat on, sends about 43 kg of carbon dioxide into the air. Where does it go? Not all of it stays there. Follow that carbon for a few years and, as an average over the last ten, about half of it is still in the air, warming the Earth. Nearly a third has dissolved in the sea, where it is slowly making the water more acidic. A fifth has been taken in by plants on land.
People now release more than 11 billion tonnes of carbon a year. This topic follows it: through the air, the sea, the rocks and living things, in numbers, and into a computer model you can run yourself to see where it will go next.
Stores and flows
You know from Grade 9 that green plants take carbon dioxide from the air, and that every living thing gives it back when it respires Grade 9: Components of an ecosystem. You know from Grade 10 where carbon dioxide comes from: burning fuels, respiration, decay and volcanoes Grade 10: Where carbon dioxide comes from. And if you have read Where Does a Fallen Leaf Go?, you have met the whole carbon cycle as a set of stores (also called reservoirs), linked by flows (fluxes).
The four great systems of the Earth are all carbon stores:
| System | Its name | Carbon is in it as |
|---|---|---|
| the air | atmosphere | carbon dioxide (and a little methane) |
| the sea, rivers and lakes | hydrosphere | dissolved carbon dioxide, hydrogencarbonate and carbonate ions, and sea life |
| rocks and the Earth below | geosphere | limestone, coal, oil, gas and carbon in other rocks |
| living things and soil | biosphere | the carbon compounds that plants, animals and microbes are built of, and dead leaves and soil |
Scientists count carbon in billions of tonnes of carbon (written GtC, gigatonnes of carbon), counting only the carbon atoms, whatever compound they are in. Two conversions are worth knowing.
- Carbon and carbon dioxide. A carbon atom has a mass of 12 and a carbon dioxide molecule 44 (12 + 2 × 16). So 12 tonnes of carbon make 44 tonnes of carbon dioxide: multiply carbon by 44/12, about 3.67, to get carbon dioxide.
- Carbon and the air. Carbon dioxide in the air is measured in parts per million (ppm): molecules of CO₂ in every million molecules of air. The whole atmosphere is so big that 1 ppm of CO₂ holds 2.12 billion tonnes of carbon.
A news report says that people released “about 42 billion tonnes of carbon dioxide” in 2025. Another says “about 11.5 billion tonnes of carbon”. Which is right?
Pick an answer to see why.
The carbon budget
Before people burned fossil fuels on a large scale, the flows into the air and out of it were nearly equal, and for thousands of years the carbon dioxide stayed between about 260 and 285 ppm. Now there is a new flow. Every year people take carbon that was locked in the rocks for millions of years (coal, oil and gas) and put it into the air, and cut down forests, releasing the carbon in their wood and soil.
Scientists of the Global Carbon Project add this up every year, as a carbon budget: like the money a family earns and spends, what goes in must equal what comes out plus what is left over. They measure each part separately:
- Fossil fuels and cement, from how much coal, oil and gas every country burns, and how much cement it makes (making cement drives CO₂ out of limestone).
- Land use: carbon released when forests are cleared or burned, minus what regrowing forests take back, from maps and satellite pictures of forests.
- The rise in the air, measured at Mauna Loa in Hawaii and many other stations.
- The sea, from millions of measurements of carbon dioxide in sea water by ships and floats, and computer models of the ocean.
- The land: forests and soils, from models of plant growth.
For 2015–2024, on average each year:
| In | Billion tonnes of carbon a year | Out | Billion tonnes of carbon a year |
|---|---|---|---|
| fossil fuels and cement | 9.8 | rise in the air | 5.6 |
| land use (mostly cutting forests) | 1.4 | taken up by the sea | 3.2 |
| taken up by plants and soil | 2.4 | ||
| total | 11.2 | total | 11.2 |
So about half of what people release stays in the air. The share that stays is called the airborne fraction. The sea and the land that take up the rest are called carbon sinks.
The carbon budget says the sea took up 3.2 billion tonnes of carbon a year in 2015–2024. Why didn’t the air’s carbon dioxide rise by all of what people released?
Pick an answer to see why.
Into the sea
Why the sea takes carbon dioxide
Open a bottle of cold soda: carbon dioxide gas fizzes out. The gas was dissolved in the water under pressure. Gases dissolve in water, and the more of a gas there is in the air above the water, the more dissolves. So when the air gets more carbon dioxide, more dissolves into the surface of the sea, until the water holds as much as the air above it can push in. Before 1750, about 60 billion tonnes of carbon passed from the air into the sea each year, and about as much came back out (Figure 40.1). Now that there is extra CO₂ in the air, more goes in than comes out.
But the sea holds far more than water could hold as a dissolved gas. That is because carbon dioxide reacts with sea water. You saw in Grade 10 that CO₂ dissolves in water to make a weak acid, carbonic acid Grade 10: Tests for carbon dioxide:
Like every acid, it gives hydrogen ions, H⁺, to the water Grade 8: Acids give hydrogen ions in water, leaving a hydrogencarbonate ion (bicarbonate):
Sea water is slightly alkaline, with a pH of about 8. Dissolved rock, carried by rivers for millions of years, has given it plenty of carbonate ions, CO₃²⁻. These take up most of the new hydrogen ions:
Add the three together and the H₂CO₃ and H⁺ cancel out:
So each molecule of carbon dioxide that dissolves uses up a carbonate ion and turns into hydrogencarbonate. That is why about 90% of the carbon in the sea is hydrogencarbonate, only about 1% is dissolved CO₂ gas, and the rest carbonate. The sea can hold more than forty times as much carbon as the air.
Then why hasn’t it taken nearly all our carbon dioxide? Because only the surface of the sea touches the air. The top 100 meters or so is stirred by the wind and mixes within weeks. Below it, the cold, heavy deep water mixes with the surface very slowly: water sinking near the poles takes centuries to come back up. So far most of our extra carbon has gone into the upper few hundred meters. The deep sea will take most of it in the end, but over many centuries.
Ocean acidification
Taking up carbon dioxide has a cost. The hydrogen ions that the carbonate doesn’t mop up make the water more acidic, and the carbonate used up is no longer there for anything else. Both changes together are called ocean acidification.
You know from Grade 8 that pH measures how acidic a solution is: 7 is neutral, below 7 acidic, above 7 basic Grade 8: The pH scale. What you may not know is what the numbers mean. The pH is a count of the zeros in the concentration of hydrogen ions:
So pH 8 means 10⁻⁸ mol/L of hydrogen ions, and pH 7 means 10⁻⁷, ten times as many. Each step of 1 on the pH scale is ten times the hydrogen ions. A fall of 0.1 is a factor of 10^0.1 = 1.26: about 26% more hydrogen ions.
Measurements of sea water and records in old corals and sediments show that the world’s surface sea had a pH of about 8.18 around 1770, 8.07 in 2000, and about 8.04 now (as of 2025), falling by about 0.0017 each year.
What it does to shells
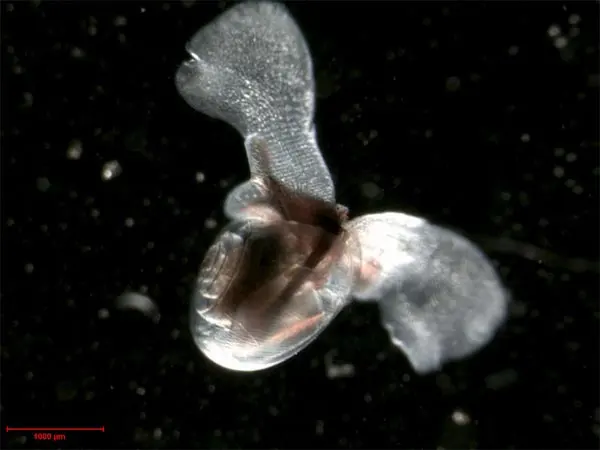
Corals, oysters, clams, snails, sea urchins and many kinds of plankton build their skeletons and shells of calcium carbonate, CaCO₃, the same compound as limestone and chalk. They make it from the calcium and carbonate ions in the sea water:
The less carbonate there is, the harder this is. Scientists measure how easy it is with a number called the saturation state: how many times more calcium and carbonate the water holds than the least it needs to keep a shell from dissolving. Above 1, a shell can form and stay; below 1, the water is undersaturated and a bare shell slowly dissolves. Coral reefs grow well only where it is about 3 or more. Many shells and corals are made of aragonite, a form of calcium carbonate that dissolves a little more easily than the calcite of limestone.
Look at what happens as you add carbon dioxide: the total carbon in the water goes up, the hydrogencarbonate goes up, but the carbonate goes down, and so does the pH. Cold water dissolves more carbon dioxide and holds less carbonate to begin with, so the polar seas reach the danger line first: at about twice 1850’s carbon dioxide, cold surface water reaches 1, the edge of undersaturation, while warm tropical water is still near 3.
There is a second effect. The more carbonate the surface sea has used up, the less it has left to react with the next carbon dioxide. So the more carbon dioxide the sea has taken, the less of each new tonne it can take: the sea becomes a weaker sink as it acidifies.
When the sea takes up carbon dioxide, which of these goes down?
Pick an answer to see why.
Onto the land
The land’s part of the budget is the hardest to measure, and it pulls in two directions.
Plants grow faster with more carbon dioxide. Carbon dioxide is the raw material of photosynthesis, and at today’s levels most plants can use more of it. Growers of tomatoes and cucumbers in glasshouses pump in carbon dioxide to raise their crops. To test whole forests, scientists ran FACE experiments (free-air CO₂ enrichment): rings of pipes around patches of forest, blowing out carbon dioxide so that the trees grew in air with about 550 ppm. In four such forests in the USA and Italy, the trees grew about 23% more than the trees outside the rings. Satellites show that between a quarter and a half of the world’s plant-covered land became greener from 1982 to 2009, most of it, scientists estimate, because of the extra carbon dioxide. (Since 2000, China and India have greened most of all, mainly from farming and tree planting.)
But people are cutting forests down. Clearing a forest for fields releases the carbon in its trees and soil, mostly as carbon dioxide. Since 1850, cutting forests has released about 250 billion tonnes of carbon, while the world’s plants and soils have taken up about 175 billion tonnes. So, so far, the land has lost more carbon than it has gained.
And a warmer world weakens the land sink. Heat and drought slow plant growth, and fire and decay release carbon faster. The Global Carbon Project estimates that, in 2015–2024, warming and changing weather made the land sink about a quarter smaller than it would otherwise have been, and the sea’s sink about 7% smaller.
You saw in Grade 10 that Nepal’s community forests have grown back since the 1990s, and that storing carbon in forests is one way to slow climate change Grade 10: Measures to control climate change. Now you can see where it fits in the budget: it adds to the land sink, and stops a forest’s carbon from being released.
Why can’t the land be counted on to take up a steady share of people’s carbon dioxide in future?
Pick an answer to see why.
Into the rocks: the slow cycle
Most of the Earth’s carbon is in its rocks, far more than in the air, the sea and living things together. Over millions of years carbon moves in and out of the rocks too, but slowly.
Out of the rocks: volcanoes. Deep in the Earth, rock containing carbon melts or is heated, and the carbon comes out as carbon dioxide in volcanoes and hot springs. All the volcanoes on land and under the sea together release about 0.3 billion tonnes of carbon dioxide a year (as of a 2019 estimate): about 0.1 billion tonnes of carbon. People release more than a hundred times as much.
Into the rocks: weathering. You may have read in What Does Water Do to Rock? how rain with carbon dioxide dissolves limestone. That doesn’t take carbon out of the air for long: the calcium carbonate goes to the sea, sea creatures build it back into shells, and building a shell gives the carbon dioxide back (look at the equations: it is the dissolving reaction run backwards). What does lock carbon away is the weathering of silicate rocks, such as granite and basalt, which contain calcium silicate minerals. Simplified:
Rivers carry the calcium and hydrogencarbonate to the sea. There, sea life builds shells of calcium carbonate, giving back one of the two carbon dioxide molecules:
Overall: CaSiO₃ + CO₂ → CaCO₃ + SiO₂. One carbon dioxide molecule from the air ends up in limestone on the sea floor for each calcium atom weathered out of silicate rock. The shells pile up as limestone, and mud full of dead plankton and plants is buried as well. Over millions of years, moving plates carry some of the sea floor down into the Earth, and its carbon comes back up in volcanoes, closing the loop.
Weathering is faster when the Earth is warmer and wetter, so it works as a slow thermostat for the Earth’s climate, over hundreds of thousands of years. How it has changed the climate in the past is in Why Has the Climate Changed Before?.
Which process takes carbon dioxide out of the air and locks it in rock for millions of years?
Pick an answer to see why.
A model of the whole system
How much of the next century’s carbon will the sea and the land take? Scientists answer questions like this with models: computer programs that follow the stores and flows year by year, using rules that describe how each flow depends on the stores. A good model is tested first against the past. If it gets the past right, it is more likely to say something useful about the future.
The widget below runs a small model of this kind, written for this book. It has four stores (the air, the top layer of the sea, the deeper sea, and the extra carbon in plants and soil) and these rules:
- People’s emissions go into the air: the real ones up to 2024, then a path you choose.
- The sea takes up carbon dioxide in proportion to how much more there is in the air than in the surface water. The surface water’s chemistry is worked out exactly as in the widget above, so it takes up less as its carbonate is used up.
- The surface layer mixes slowly into the deeper sea.
- Plants grow faster as the carbon dioxide rises, and the extra carbon they store returns to the air over a few decades.
Its few numbers were adjusted so that it matches the carbon dioxide measured at Mauna Loa from 1960 to 2024 (within about 3 ppm), and how much the sea and the land took up each year in 2015–2024, by the carbon budget.
Read the results like a scientist:
- Air, sea and life are linked. In every path, whatever raises the carbon dioxide in the air also lowers the pH of the sea and its carbonate, and makes plants grow faster. One change ripples through all of them.
- Steady emissions don’t mean steady carbon dioxide. Holding emissions at today’s level keeps the carbon dioxide rising, by more than 2 ppm a year: the sinks take only about half.
- Zero emissions don’t take us back. When emissions fall to zero, the carbon dioxide stops rising and falls, but only slowly, and stays far above 1850’s. Most of the extra carbon stays in the air for centuries, until the deep sea mixes it in; the last part waits for the rocks.
In the model, emissions stay at 2025’s level from 2025 to 2100. What happens to the carbon dioxide in the air?
Pick an answer to see why.
Questions
In 2015–2024 the airborne fraction was about 50%. If people released 12 billion tonnes of carbon in one year, roughly how much would the carbon dioxide in the air rise?
Pick an answer to see why.
Which of these is evidence that the extra carbon dioxide in the air comes from burning fossil fuels, not from volcanoes?
Pick an answer to see why.
Explain the difference between a carbon store and a carbon flow, and give one example of each for the hydrosphere.
Answer
A store is a place where carbon is held, measured as an amount (billions of tonnes of carbon); a flow is the rate at which carbon moves from one store to another, measured as an amount per year. In the hydrosphere: the deep sea is a store, holding about 37,000 billion tonnes of carbon, mostly as hydrogencarbonate ions; carbon dioxide dissolving from the air into the surface sea is a flow, about 60 billion tonnes a year before 1750 and more now, with a little less coming back out.
In the 1960s, the Global Carbon Project’s budget for an average year was: released by people 4.9 billion tonnes of carbon; rise in the air 1.7; taken up by the sea 1.3; taken up by the land 0.9.
- a.What was the airborne fraction?
- b.Add up the air, the sea and the land. Does the budget balance? What might explain the difference?
- c.Compare the 1960s with 2015–2024 (11.2 released; air 5.6, sea 3.2, land 2.4). What has changed?
Answer
- a.Airborne fraction = 1.7 ÷ 4.9 = 35%.
- b.1.7 + 1.3 + 0.9 = 3.9, a billion tonnes less than the 4.9 released. Carbon can’t vanish, so at least one of the numbers must be wrong: each is measured separately and has its own uncertainty. The emissions from cutting forests and the land sink are the hardest to measure, so they are the likeliest; the rise in the air, measured directly, is the most certain. Scientists call the difference the budget imbalance and publish it, rather than hiding it.
- c.Emissions have more than doubled (4.9 to 11.2), and the air’s gain and the sea’s and land’s uptake have all grown with them: there is more carbon dioxide in the air pushing into the sinks. But the airborne fraction has risen from about 35% to about 50%. (Single years swing a lot, so scientists compare averages over ten years.)
Explain, with an equation, why the sea’s carbonate ions decrease as it takes up carbon dioxide, and why this matters for coral reefs.
Answer
Carbon dioxide dissolves and reacts with water to make carbonic acid, which gives hydrogen ions; most of the hydrogen ions react with carbonate ions to make hydrogencarbonate. Overall: CO₂ + H₂O + CO₃²⁻ → 2HCO₃⁻. Each molecule of CO₂ taken up uses up one carbonate ion. Corals build their skeletons of calcium carbonate (aragonite) from calcium and carbonate ions in the water, Ca²⁺ + CO₃²⁻ → CaCO₃. With fewer carbonate ions, the water’s saturation state falls, so building is slower and costs the coral more energy, and reefs grow more slowly and are worn away more easily. If the water ever became undersaturated, bare skeleton would dissolve.
The pH of a sample of sea water falls from 8.10 to 7.90. By what factor has its concentration of hydrogen ions changed? Is it now acidic?
Answer
Factor = 10^(8.10 − 7.90) = 10^0.20 = 1.58: about 58% more hydrogen ions. It is not acidic: its pH is still above 7, so it is still slightly basic, only less so. It has been made more acidic, which is what “acidification” means.
Use the model (the widget Run the carbon model) to answer:
- a.In 2024, what share of the carbon released since 1850 is in the air, the sea and the land?
- b.With emissions kept rising after 2025, what are the carbon dioxide and the sea’s pH in 2100?
- c.With emissions falling to zero by 2060, what is the carbon dioxide in 2100? Explain why it isn’t back to 1850’s level.
Answer
- a.About 47% in the air, 31% in the sea and 22% in the land. The real carbon budget gives about 39% in the air, 27% in the sea and 23% in the land, and cannot find the last 11%: its measured stores add up to less than the estimated emissions (the budget imbalance). The model has no such gap, because it counts only about half of the estimated emissions from cutting forests, the least certain number, so that its books balance; that is why its shares differ.
- b.About 710 ppm, and a pH of about 7.84, with only about half of 1850’s carbonate left for shells.
- c.About 404 ppm, after a peak of about 445 ppm in the early 2040s: far above 1850’s 285 ppm. The carbon has not gone away: the air shares it with the surface sea and plants, which soon fill up, and the deep sea takes centuries to mix in. Only the deep sea, over centuries, and the rocks, over hundreds of thousands of years, can take most of it.
A friend says: “Carbon dioxide is plant food, so more of it is good for the planet.” Using what you have learned about at least two of the Earth’s systems, write a reply.
Answer
It is true that more carbon dioxide makes many plants grow faster: in forest experiments with about 550 ppm, trees grew about 23% more, and the land takes up about a fifth of what people release. But the same carbon dioxide affects other systems at once. In the atmosphere it traps heat and warms the Earth, and heat, drought and fire are already weakening the land’s uptake, in hot years like 2024 most of all. In the hydrosphere, the sea takes up nearly a third of it, which lowers the sea’s pH and uses up its carbonate, making it harder for corals, oysters and plankton to build shells, with effects up the food chain. So whether it is “good” depends on all the systems it affects, not only on plants.
Where to go next
- Why Has the Climate Changed Before? What sets a planet’s temperature, the ice ages, and the slow carbon thermostat of the rocks.
- Can One Change Set Off Many More? Feedbacks in the Earth’s systems: why melting ice and a weakening carbon sink can make warming bigger.
- How Did Life Change the Air? How bacteria filled the air with oxygen and took carbon dioxide out of it, and changed rocks and seas.