
Anyone who has walked on snow in the mountains on a sunny day knows two things. You need dark glasses, because the snow throws almost all the sunlight back up into your eyes. And a black rock sticking out of the snow is warm to touch, while the snow around it stays frozen. Look closely and you see a ring of melted snow round every rock.
Now think what happens when a warm spring melts a patch of snow on a Himalayan slope. Bare rock appears. The rock takes in sunlight that the snow would have thrown back, so it warms, and melts the snow beside it. More rock appears, which takes in more sunlight, which melts more snow. The first change has set off a second change, and the second feeds back into the first and makes it bigger.
Other changes do the opposite: they set off changes that undo them, and the system settles back. Which kind of change is it, and how can you tell from measurements? That is what this topic is about.
When a change feeds on itself
You met climate change in Grade 10 as two lists: its causes (greenhouse gases, cutting forests, changes in how much sunlight the Earth reflects) and its effects (melting snow, glacial lakes, drought and floods) Grade 10: Grade 10: Causes of climate change. But in the real Earth, an effect is often also a cause. Melting snow is an effect of warming, and also a cause of more warming. When an effect comes back round and changes its own cause, the chain of changes has closed into a feedback loop.
There are two kinds, and you know both from daily life.
At a school program, someone holds the microphone too close to the loudspeaker. A small sound goes into the microphone, comes out of the speaker louder, goes back into the microphone, comes out louder still, and in a second there is a terrible howl. Each time round the loop, the change grows. This is an amplifying feedback, also called a positive feedback or a reinforcing loop.
The water tank on your roof has a float valve. As the tank fills, the float rises and slowly closes the valve, so less water flows in. If someone opens a tap and the level falls, the float drops and the valve opens again. Whatever happens, the level is pulled back to the same place. This is a balancing feedback, also called a negative feedback or a stabilizing loop.
How to tell which kind a loop is
Write the loop as a chain of links, each saying how one thing changes the next. A link is same if more of the first thing gives more of the next (more sound in, more sound out). It is opposite if more of the first gives less of the next (a higher float, less water flowing in). Then go once round the loop and count the opposite links:
- an even number of opposite links (0, 2, 4…): the change comes back round pushing the same way. Amplifying.
- an odd number (1, 3…): it comes back pushing the other way. Balancing.
It works like multiplying signs: two minuses make a plus. For the tank: higher level → float closes the valve more (same) → less water flows in (opposite) → the level rises less (same). One opposite link, so the loop is balancing, as you know it is.
A loop has three links: warmer air → more water evaporates (same); more water vapor in the air → more heat held in by the greenhouse effect (same); more heat held in → warmer air (same). What kind of loop is it?
Pick an answer to see why.
Snow, ice and sunlight
The share of the sunlight falling on a surface that it reflects is its albedo, from the Latin albus, white. It is written as a fraction from 0 (reflects nothing, absorbs all) to 1 (reflects all). You saw in Grade 8 that dark, dull surfaces absorb more sunlight than white ones Grade 8: Grade 8: The color of an object and radiation. Albedo puts a number on it:
| Surface | Albedo (typical) | Share of sunlight absorbed |
|---|---|---|
| fresh snow | 0.80–0.90 | 10–20% |
| snow-covered sea ice | up to 0.90 | 10% or more |
| bare sea ice | 0.50–0.70 | 30–50% |
| old, dirty snow | about 0.5 | about 50% |
| bare glacier ice | about 0.3–0.4 | 60–70% |
| grass and crops | about 0.2–0.25 | 75–80% |
| forest | about 0.1–0.15 | 85–90% |
| rock, soil and the rubble on glaciers | about 0.1–0.2 | 80–90% |
| open sea or a lake | about 0.06 | 94% |
The Earth as a whole has an albedo of about 0.30: it reflects about 30% of the sunlight it gets, as you learned in Grade 10, mostly from clouds, snow and ice.
The ice–albedo loop
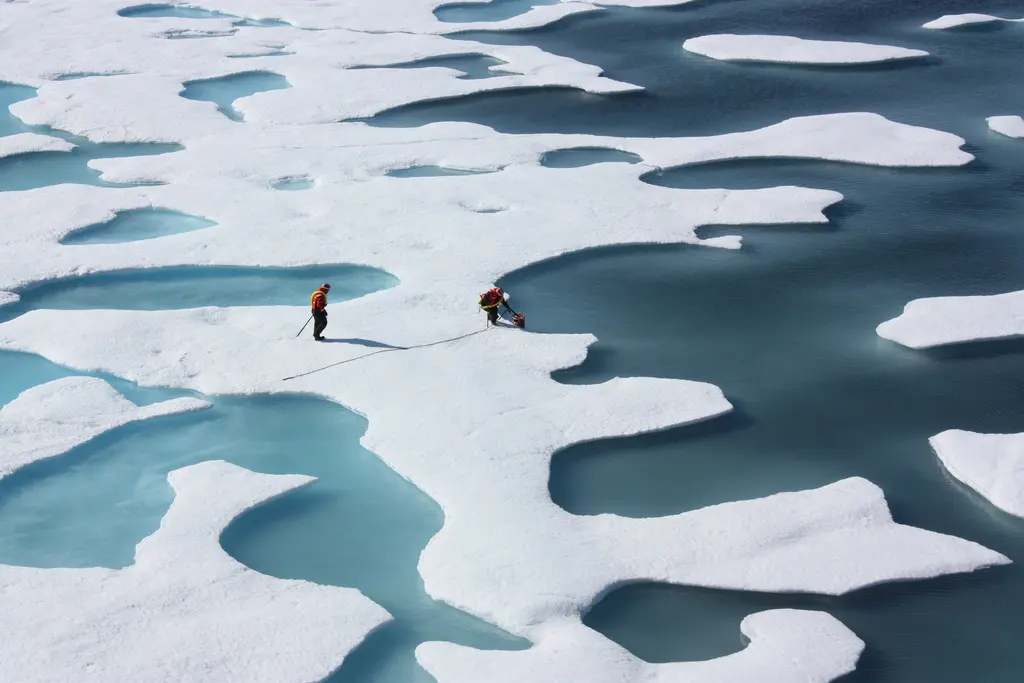
Now put the links together. Something warms the Arctic or the Himalaya a little. Some snow and ice melt (warmer → less ice: opposite). With less ice, less of the ground or sea is bright (less ice → lower albedo: same). A lower albedo means more sunlight absorbed (opposite). More sunlight absorbed means more warming (same). Two opposite links: an even number, so the loop is amplifying. This is the ice–albedo feedback. (Grade 10 mentions it in one sentence, under changes in how much sunlight the Earth reflects; here you can see why it is a loop, and below, the evidence that it is happening.)
It works in reverse too. If the Earth cools a little, snow lasts longer and spreads further, the albedo rises, less sunlight is absorbed, and the Earth cools more. An amplifying loop makes any change grow, whichever way it goes.
The evidence from the Arctic
An idea is not enough: scientists need data to show a feedback is really happening. The best place to look is the Arctic Ocean, round the North Pole. Much of it is covered by sea ice, frozen seawater a few meters thick, which melts back every summer and freezes again in winter. It is smallest in September. Satellites have measured it since late 1978.
Notice how much the points jump about from year to year. The record low, 3.57 million km² in 2012, was followed by 5.21 in 2013. Weather, winds and storms push the ice around, so one year tells you little. That is why scientists look at the trend over many years, not at one year. Even so, every September from 2007 to 2026 had less ice than any September before 2007.
The shrinking ice is the first link. Is the rest of the loop really there? Two more sets of measurements say it is.
- The Arctic got darker. Satellites also measure how much sunlight is reflected back to space. In 2014 three scientists in California, Kristina Pistone, Ian Eisenman and V. Ramanathan, showed that the Arctic’s albedo fell from 0.52 to 0.48 between 1979 and 2011, as the ice gave way to open sea. That meant the Arctic was taking in about 6.4 W more sunlight on every square meter, averaged over the whole year. Clouds hadn’t changed enough to explain it; the lost ice did.
- The Arctic warmed fastest. Since 1979 the Arctic has warmed nearly four times as fast as the Earth as a whole (Mika Rantanen and others, 2022). The ice–albedo loop is one of the main reasons, together with others in the air above the Arctic.
So the chain holds, link by link: less ice (measured), a darker Arctic (measured), more sunlight absorbed (measured), more warming (measured), and the warming is greatest exactly where the ice is going. That is how a scientist makes the claim that one change set off the others.
Between 1979 and 2011 the Arctic’s albedo fell from 0.52 to 0.48. What does this tell you on its own?
Pick an answer to see why.
In the Himalaya
The same loop runs on Nepal’s glaciers. When winter snow melts off a glacier in spring, it uncovers older, dirtier snow and gray ice, which absorb far more sunlight. Many of Nepal’s glaciers are covered by rock rubble near their ends, and where it is thin, the dark rubble warms and melts the ice under it faster. (Where it is thicker than a few centimeters, it does the opposite: it shades the ice like a blanket.) And where meltwater collects into a lake, the dark water absorbs most of the sunlight that falls on it, warms, and eats into the ice cliff at its edge, which breaks off in blocks. The lake grows, so it absorbs more sunlight, so it grows faster.
Imja Tsho, below Island Peak in the Everest region, was a few small ponds on the glacier in 1962, about 0.03 km² of water. By 2013 it was a lake of 1.35 km², with much of the glacier’s loss happening where its ice broke off into the lake Grade 10: Grade 10: Glacial lake outburst floods.
Loops that hold things steady
If the ice–albedo loop makes every warming bigger, why hasn’t the Earth’s temperature run away, up or down, long ago? Because there is a stronger loop pulling the other way.
Every warm object gives off heat as infrared radiation, and the hotter it is, the more it gives off: a hot iron radiates far more than a warm one. The Earth is the same. If it warms, it gives off more infrared to space, so it loses energy faster, which cools it back. Warmer → more heat given off (same) → less energy kept (opposite) → cooler (same). One opposite link: balancing. This loop is the reason the Earth settles at a steady temperature at all, and it is far stronger than any other: for each degree of warming, the whole Earth gives off about 3.2 W more on every square meter.
Other loops add to it or take from it:
- Water vapor (amplifying). Warmer air takes up more water vapor, about 7% more for every °C, and water vapor is a greenhouse gas. It is the strongest of the amplifying loops.
- Ice–albedo (amplifying), as you have seen.
- Clouds (both). Low, thick clouds reflect sunlight and cool; high, thin clouds hold heat in and warm. How clouds will change is the hardest part of the climate to pin down, but the evidence so far says their total effect amplifies warming a little.
- Frozen ground (amplifying). The ground of the far north, and of the high Himalaya and Tibet, stays frozen all year: permafrost. The permafrost of the far north holds the remains of plants that never rotted: more than one and a half times as much carbon as there is in the air today. As it thaws, microbes rot them and release carbon dioxide and methane, which warm the Earth more.
How much does a loop multiply a change?
Suppose something pushes the Earth’s temperature up by an amount we call the push. The amplifying loops then add more warming: if they add a fraction f of the push in the first round, that extra warming goes round the loop too, and adds f of itself, and so on, each round smaller than the last. The total is
The fraction f is the loop’s feedback strength. If f is 0, there is no feedback; if f is between 0 and 1, the change grows but settles at a bigger value; if f is negative, the loop is balancing and the change ends up smaller than the push. And if f reached 1 or more, each round would be as big as the last or bigger, and the change would never settle: a runaway.
Notice that at large f, a small change in f makes a big change in the total: at f = 0.6 the total is 3.0 °C, at 0.7 it is 4.0 °C, at 0.8 it is 6.0 °C. That is why scientists work so hard to measure the cloud feedback: a small uncertainty in f means a large uncertainty in the warming.
Plants, rain and soil
Feedback loops don’t only run between ice and air. One of the most important runs between plants, water and soil, and you can see it on Nepal’s hills.
Stand in a forest during monsoon rain. The rain hits leaves first, and drips down gently. Under the trees, a spongy layer of fallen leaves and the roots of plants hold the soil open, and the water soaks in (it infiltrates). It flows slowly through the ground, and comes out weeks later in springs and streams. Now stand on a bare, grazed slope in the same rain. The drops hit the bare soil hard, knock its grains loose and seal its surface. The water can’t soak in fast enough, so it runs off over the surface, gathering into little channels that carry the soil away.
Measurements on test plots in Nepal’s Middle Hills show how big the difference is. Undisturbed forest and grassland lost less than 0.1 t of soil per hectare a year. Degraded sal forest lost 3 to 10 t. Bare slopes lost more than 15 t. The plots also showed that the plants close to the ground, and the fallen leaves, mattered more than the trees above: a forest whose undergrowth has been grazed and swept away loses soil even under a full canopy.
Now follow the loop. Fewer plants → more runoff (opposite) → more soil washed away (same) → thinner soil, holding less water and fewer nutrients (opposite) → fewer plants can grow (same)… Two opposite links, an even number: amplifying. Once a slope has lost enough of its cover and soil, it can go on losing them even if nobody cuts or grazes there any more. And the change spreads to other systems: the washed-off soil fills rivers and reservoirs downstream, springs fed by water that used to soak in dry up in the dry season, and floods come faster after rain.
There is good news too: the loop also runs backwards. In the 1970s and 80s, many of Nepal’s hills were losing their forests fast. When forests were handed to the communities beside them, the cover came back on many hills, and with it the undergrowth and fallen leaves that hold the soil and let rain soak in Grade 10: Grade 10: Measures to control climate change. An amplifying loop can be turned round, if something pushes hard enough the other way.
When a wetland dries
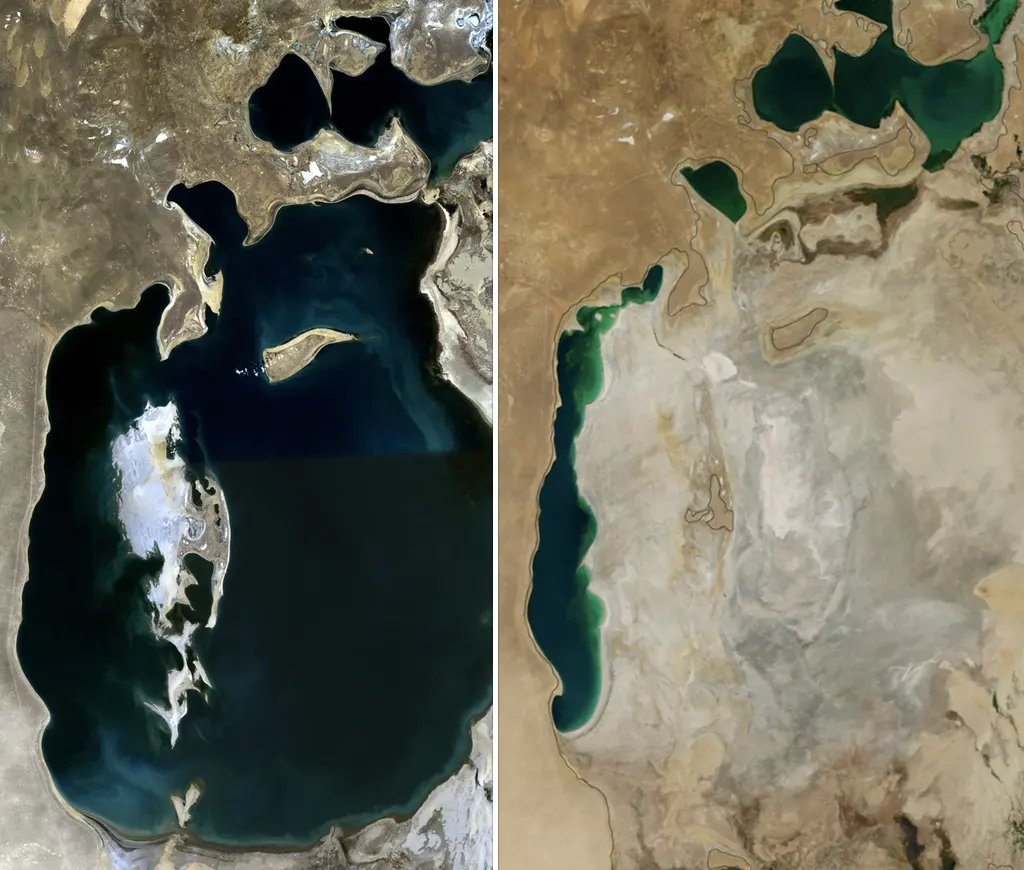
Wetlands and lakes can have a loop of their own. Their water evaporates and keeps the air above them humid, and some of that water comes back nearby as dew, mist and rain. If a wetland shrinks, less water evaporates, the air gets drier, less water comes back, and the wetland shrinks more: less wetland → less evaporation → less humidity → less dew and rain → less wetland. Every link is “same”: zero opposite links, so the loop is amplifying. (Careful: if you write “drier air” instead of “less humidity”, that link becomes “opposite” and the next one does too, and the count is still even. The answer can’t depend on how you name things, and it doesn’t.)
The biggest example is the Aral Sea in Central Asia, once the world’s fourth-largest lake. From the 1960s, most of the water of the two rivers that fed it was taken off into canals to water cotton fields. The lake shrank to a small part of its size. Around where it was, the summers have become hotter and the winters colder: without the water to warm the air in winter and cool it in summer, the land swings between extremes. Salty dust now blows off the dry lake bed onto the fields around.
On a hillside, a road is cut and its loose soil is left bare. In the first monsoon, deep channels are carved in the slope. Which sentence describes the loop that keeps the channels growing?
Pick an answer to see why.
One dam, many changes
A dam is a change to one small part of the Earth’s surface: a wall across a river. Follow what it sets off.
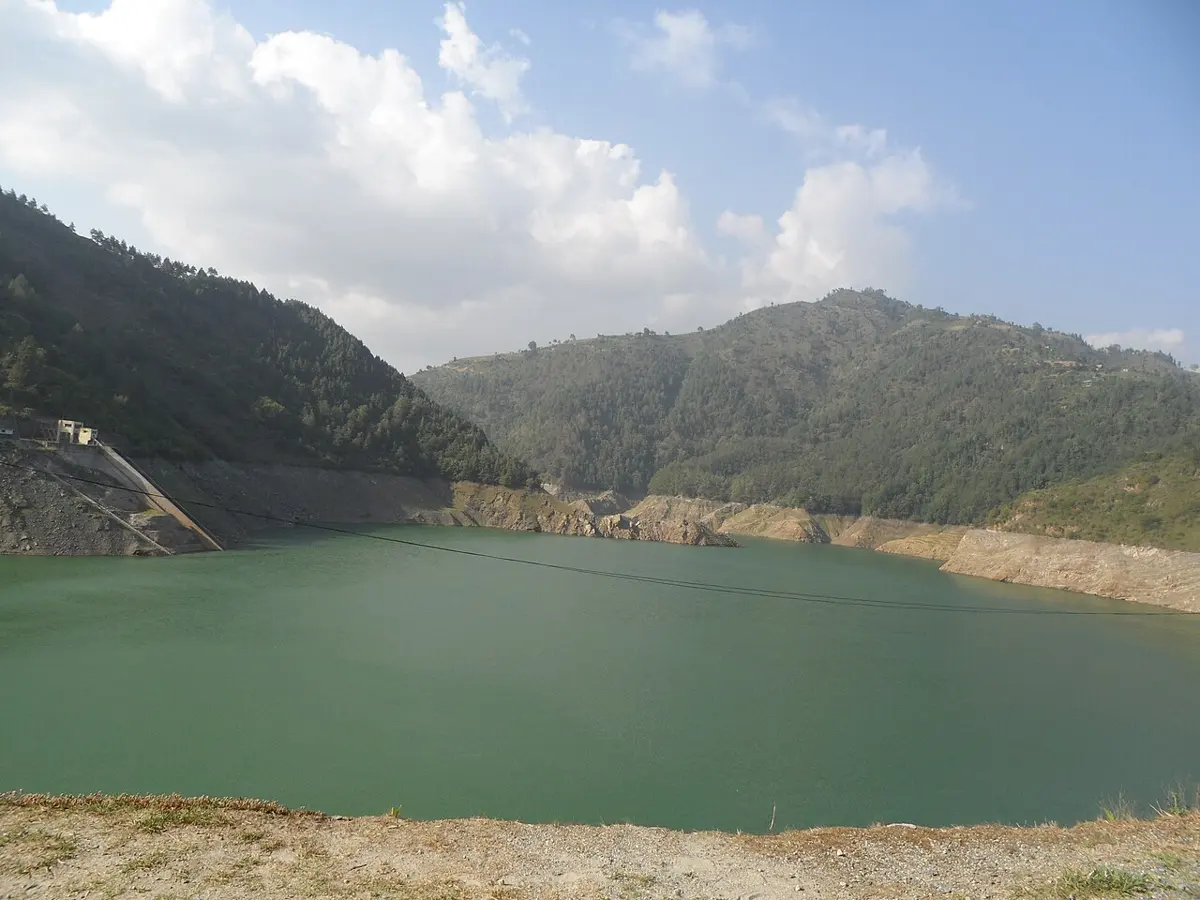
- Upstream: the river stops, and drops its load. Behind the dam, the river’s water slows to almost nothing in the reservoir, so the sand and silt it was carrying settles to the bottom. Reservoirs slowly fill up. Nepal’s Kulekhani reservoir (Indra Sarobar, in Makwanpur), finished in 1982, could hold 85.3 million m³ when it was new. In July 1993 a huge cloudburst over its hills, with more than 500 mm of rain in a day at one rain gauge, washed in enormous amounts of soil and rock, and by 2010 the reservoir held only 64.9 million m³. Check dams have since been built upstream to catch sediment before it arrives.
- Around the reservoir: the ground fills with water. Water from the reservoir seeps into the rock and soil around it, so the groundwater rises, and wells nearby may fill more easily. (In the wrong rocks, it can also make slopes slide.)
- Downstream: hungry water. The water let out below the dam is clear: it has left its load behind. A river that can carry sand but has none picks it up from its own bed and banks, so below many dams the riverbed is dug deeper, and its banks collapse. Engineers call it hungry water. Here there is a balancing loop: as the river washes out the fine sand, the bed is left covered with coarse stones it can’t move, and the digging slows down.
- At the coast: the delta shrinks. A river’s delta is built from the sediment it brings to the sea, while waves wash sediment away. With the sediment held back by dams, the waves win. After Egypt finished the Aswan High Dam in 1970, the sediment the Nile carried to the Mediterranean fell from more than 100 million tonnes a year to almost none, and in places the coast of its delta retreated by more than 100 m a year before sea walls were built.
Not every chain of changes is a loop. A dam starving a delta of sand is a chain: one change causes another, which causes another, but nothing comes back round to change the dam. A loop needs the last change to act on the first. Both matter, and in the real Earth they are tangled together.
After a dam is built, the riverbed for many kilometers below it is dug deeper. Why?
Pick an answer to see why.
Questions
Which of these is a balancing feedback?
Pick an answer to see why.
A climate scientist says “the feedback is positive”. She means
Pick an answer to see why.
Draw the ice–albedo feedback as a loop of four boxes. Label each arrow “same” or “opposite”, and use your labels to show that the loop is amplifying.
Answer
warmer → less snow and ice (opposite) → lower albedo (same: less ice, less reflection) → more sunlight absorbed (opposite) → warmer (same).
There are two opposite links. Two is an even number, so the change that comes back round pushes the same way as the starting change: the loop is amplifying. (Started with a cooling, it works the same way: cooler → more ice → higher albedo → less absorbed → cooler.)
A patch of snow (albedo 0.80) melts, uncovering grass (albedo 0.25). The sunlight averaged over a spring day is 300 W/m². a. How much more energy does each square meter absorb, in watts? b. How much more energy is that in one day, in joules? c. How much snow could that extra energy melt from the edge of the next patch? (L = 334,000 J/kg.)
Answer
- a.Snow absorbs (1 − 0.80) × 300 = 60 W/m²; grass absorbs (1 − 0.25) × 300 = 225 W/m². The extra is 225 − 60 = 165 W/m².
- b.One day is 24 × 3,600 = 86,400 s: 165 W × 86,400 s = about 14,300,000 J (14.3 MJ) for each square meter.
- c.m = Q ÷ L = 14,300,000 ÷ 334,000 = about 43 kg of snow, if it all went into melting. (In fact, some of the heat warms the air and ground instead, but even a part of it is a lot.)
The table gives the average September Arctic sea-ice cover for three ten-year periods (data: NSIDC).
| Years | Average September sea ice (million km²) |
|---|---|
| 1979–1988 | 7.21 |
| 1997–2006 | 6.16 |
| 2017–2026 | 4.61 |
a. How much ice was lost between the first two periods, and between the last two? b. Did the loss speed up, slow down or stay the same? c. Make a claim about the ice–albedo feedback in the Arctic, and say what other evidence you would need to support it.
Answer
- a.From 1979–1988 to 1997–2006: 7.21 − 6.16 = 1.05 million km² in 18 years. From 1997–2006 to 2017–2026: 6.16 − 4.61 = 1.55 million km² in 20 years.
- b.Per decade, that is 1.05 ÷ 1.8 = 0.58 and 1.55 ÷ 2.0 = 0.78 million km² per decade: the loss sped up. (Look at Figure 39.2, though: most of the second fall came in the years up to 2007. Since then the September ice has stayed low, with big swings but no clear further fall. Averages hide such details, which is why scientists look at every point too.)
- c.Claim: the loss of sea ice is making the Arctic absorb more sunlight, which adds to the warming there and melts more ice. The sea-ice data show only the first link. To support the claim you also need: measurements that the Arctic reflects less sunlight than it did (satellites show its albedo fell from 0.52 to 0.48, 1979–2011); evidence that the extra sunlight absorbed is not caused by something else, such as fewer clouds; and temperature records showing the Arctic warming faster than elsewhere (nearly four times the global rate since 1979).
For a push of 2.0 °C, what is the total change when the feedback strength is a. 0.25, b. 0.75? c. Why do scientists say that feedbacks make the climate’s response uncertain, even when the push is known exactly?
Answer
- a.2.0 ÷ (1 − 0.25) = 2.0 ÷ 0.75 = 2.7 °C.
- b.2.0 ÷ (1 − 0.75) = 2.0 ÷ 0.25 = 8.0 °C.
- c.The total depends on 1 ÷ (1 − f), which grows very fast as f gets close to 1. A strength of 0.65 or 0.75 might look like a small difference, but it changes the total from 2.9 times to 4 times the push. The feedbacks, especially the clouds, are not known exactly, so the warming they lead to has a wide range, even when the push is known.
A farmer clears a steep forested slope above a village in the Middle Hills for grazing. Using the idea of feedback, explain what may happen to the slope over the next twenty years, and to the village’s spring and the stream below it.
Answer
Without trees, undergrowth and fallen leaves, monsoon rain hits the soil directly and much more of it runs off instead of soaking in. The runoff carries soil away: Nepal’s test plots lost less than 0.1 t per hectare a year under undisturbed forest, but more than 15 t on bare ground. Thinner soil holds less water and fewer nutrients, so fewer plants can grow back, so even more of the next monsoon runs off: an amplifying loop, and the slope may go on eroding even if grazing stops, and may slide. Other systems change too: less rain soaks into the ground, so the spring fed by that water flows less, and may dry up in the dry season; the stream below rises faster and higher after rain, and carries more mud and sand, which fills its bed and any pond or reservoir downstream.
A new dam is built on a river in the hills. Describe one change it causes upstream, one around the reservoir, one in the riverbed downstream and one at the far end of the river. Which of these involves a balancing loop?
Answer
- Upstream, in the reservoir: the water slows and its sediment settles, so the reservoir slowly fills up.
- Around the reservoir: water seeps into the ground, so the groundwater rises.
- Downstream: the clear “hungry” water picks up sand from its own bed and banks, so the bed is dug deeper and the banks collapse.
- At the river’s end: less sediment reaches the delta or the plains, so the coast or the riverbanks there are worn away faster than they are built.
The downstream digging includes a balancing loop: as the fine sand is washed out, the bed is covered by coarse stones the river can’t move, and the digging slows down.
Where to go next
- Why Has the Climate Changed Before? The ice ages came and went as the Earth’s orbit slowly changed, with feedbacks like Croll’s turning small changes into big ones.
- Where Does the Carbon Go? Following carbon through the air, the sea, rocks and living things, and how the carbon cycle feeds back on the climate.
- What Does Water Do to Rock? How water breaks rock, dissolves it and carries it away: the erosion and sediment in this topic, from the rock’s side.