
If you are 15 now, in 2050 you will be about 40. You may have a job, a home, children of your own. What will the summers be like in Bhaktapur then? How much ice will be left on the mountains you can see from the Kathmandu Valley on a clear winter morning? Will the monsoon be kinder or harsher to the farmers who grow your rice?
Nobody can tell you whether it will rain on your 40th birthday. The weather forecast on the news is good for a few days and hardly better than a guess after about ten. Yet climate scientists say, with numbers and with ranges, how warm the world will be in the 2050s and the 2090s. How can anyone forecast decades ahead when nobody can forecast next month? This topic shows how: from the records that tell us how fast the climate is changing now, to the computer models that say where it is going, and how sure we can be.
Weather can’t be forecast far ahead, but climate can
You know from Grade 10 that weather is the state of the air at one place and time, and climate is the average weather over about 30 years Grade 10: Weather and climate, and that the Earth’s climate is changing, mostly because of people Grade 10: What climate change is. You also met the effects already felt in Nepal: the temperature rising by about 0.06 °C a year, glaciers shrinking, glacial lakes growing Grade 10: Effects of climate change.
Here is why the two kinds of forecast are so different. Think of throwing a die. Nobody can say what the next throw will show. But throw it 600 times and you can say, with confidence, that about 100 of them will be sixes. A single throw is unpredictable; an average over many throws is not.
The weather on one day is like one throw. Tiny differences in the air today grow, day by day, into big differences in next week’s weather, so beyond about ten days a forecast loses its grip. The climate is the average over many years of weather, like the average of many throws. And now suppose someone has been loading the die, sticking a little weight on one face so that sixes come up more often. You still can’t say what the next throw will be, but you can say that sixes will be more common, and, if you know how heavy the weight is, by how much. Greenhouse gases load the climate’s die. A climate forecast doesn’t tell you the weather on a date; it tells you how the averages and the odds will change.
A friend says: “Scientists can’t even tell me if it will rain next Saturday. How can they say what the climate will be like in 2050?” What is the best answer?
Pick an answer to see why.
The world’s thermometer
To know how fast the climate is changing, we first need to measure it. That sounds simple: read a thermometer. But the question is about the whole Earth, and the change so far is less than 1.5 °C, less than the difference between a sunny spot and the shade beside it.
Thousands of thermometers
Every day, more than 10,000 weather stations on land write down the temperature, some of them for more than 150 years. Nepal’s Department of Hydrology and Meteorology runs stations across the country, from the Terai to the high mountains, and most of its records go back to the 1960s and 70s. Over the sea, which covers 71% of the Earth, ships have measured the water’s temperature since the 1850s (first by hauling up a bucket of sea water), and today thousands of floating buoys send their readings by satellite.
Several teams of scientists, working separately, turn these millions of readings into one number for each year: Britain’s Met Office with the University of East Anglia (a record called HadCRUT), NASA and NOAA in the USA, Japan’s weather service, and Berkeley Earth, started in 2010 by a physicist who doubted the others’ work and wanted to check it. They make different choices and use different methods. Their results agree to within about a tenth of a degree.
Why scientists use the change, not the temperature
Kathmandu at noon in June might be 30 °C; Everest’s summit, the same moment, −20 °C. Averaging thermometers spread so unevenly over mountains and plains would give a number that jumps about whenever a station is added or closed. So each station is compared with its own usual temperature, and only the difference is used. This difference is the temperature anomaly: how much warmer or cooler a place was than usual. Anomalies are much more alike over large areas than temperatures are: a warm month in Pokhara is usually a warm month in Bhaktapur too, even though Bhaktapur is cooler. So they can be averaged over the whole Earth.
For climate change, the “usual” is taken as the average of 1850–1900, before burning coal, oil and gas had warmed the world much. Scientists call it the pre-industrial level. When you read “the world is 1.4 °C warmer”, it means 1.4 °C warmer than 1850–1900.
What the record shows
According to the HadCRUT record, the world in 2015–2024 was on average 1.26 °C warmer than in 1850–1900. 2024 was the warmest year ever measured, about 1.55 °C above pre-industrial by the average of the main records, helped by a strong El Niño (a warming of the eastern Pacific Ocean that heats the whole world for a year or so). 2025 was the second or third warmest, about 1.44 °C (as of 2026). The eleven warmest years in the record are the last eleven, 2015 to 2025.
But the record also wobbles. Some years are cooler than the year before, and in some decades it seemed to rise hardly at all. To see how fast the climate is changing, you have to see through the wobbles, and that needs a straight line.
A line of best fit drawn through many years is called a trend. The trend since 1975 is about 0.2 °C a decade. Over the last ten years it has been faster, about 0.27 °C a decade, as greenhouse gases kept rising while the haze of air pollution that partly hid their effect was cleaned up.
Using the averages of two whole decades, not two single years, is a simple way of seeing through the wobbles. A line of best fit, as in the widget, does the same job with every year.
Over 15 years, the temperature record rises much more slowly than its 50-year trend. What is the most likely explanation?
Pick an answer to see why.
Other records that agree
A thermometer record could have mistakes in it. The best test is to check it against things measured in completely different ways. If they all tell the same story, the story is very likely true. Several of them have their own topics in this book.
| Record | How it is measured | What it shows |
|---|---|---|
| Carbon dioxide in the air | at Mauna Loa in Hawaii since 1958, and at stations round the world | up from about 280 ppm before factories to about 425 ppm in 2024, the highest for at least 800,000 years |
| The past’s air and temperature | air bubbles and water in Antarctic ice cores | carbon dioxide and temperature rose and fell together through the ice ages |
| Heat in the ocean | about 4,000 Argo floats, robots that sink to 2,000 m and rise again every 10 days, measuring as they go | the sea has taken up about 90% of the extra heat trapped since 1970 |
| Sea level | tide gauges in harbors since the 1800s; satellites measuring the sea’s height since 1993 | up about 20 cm since 1900, and rising faster: 3.7 mm a year in 2006–2018 |
| Sea ice | satellites since 1979 | the Arctic’s summer sea ice has shrunk by more than a third |
| Glaciers | stakes on the ice, photos, satellite maps of height | almost every glacier in the world is shrinking |
The carbon dioxide record is in Where Does the Carbon Go?, the ice cores in Why Has the Climate Changed Before?, and the Arctic’s sea ice in Can One Change Set Off Many More?. Here, we look at the record closest to Nepal: its glaciers.
Why does it matter that the ocean’s heat, the sea level and the glaciers all show the same change as the thermometers?
Pick an answer to see why.
Weighing a glacier
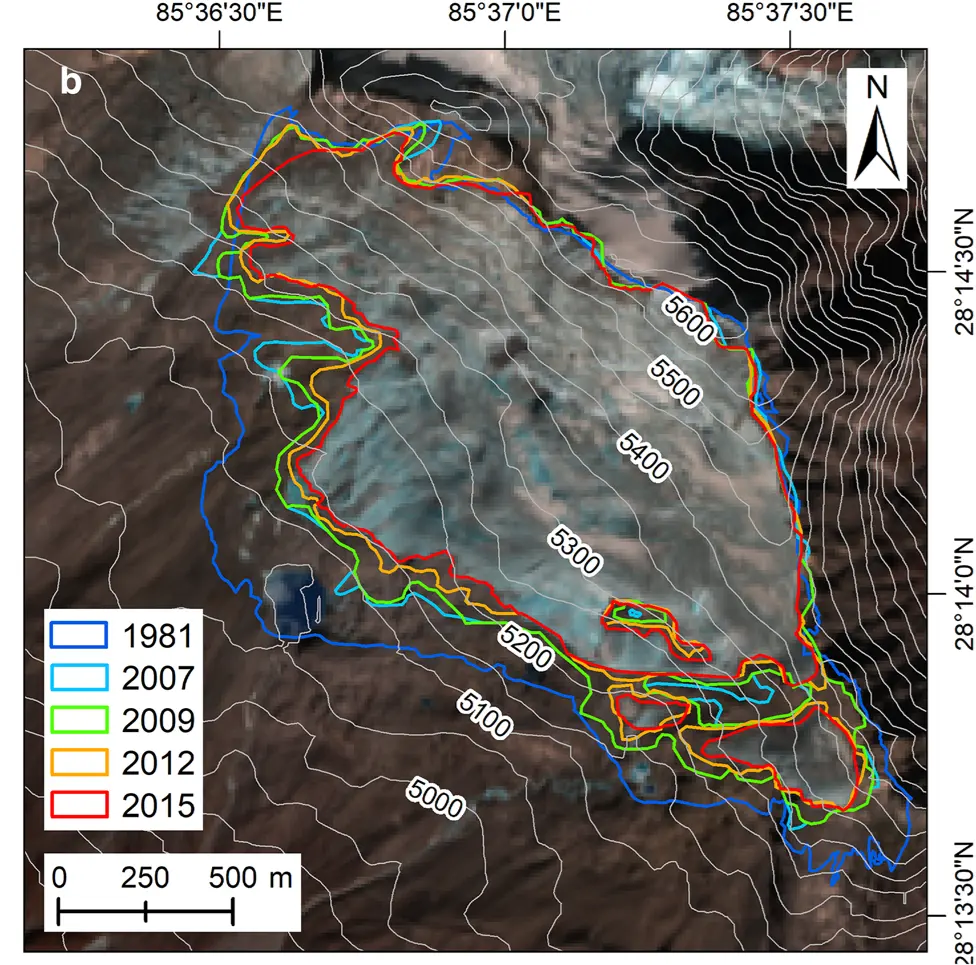
Nepal has about 3,800 glaciers, covering about 3,900 km², 2.6% of the country (ICIMOD’s count from satellite pictures of 2010). Between 1977 and 2010 their area shrank by about a quarter. How do scientists know how much ice a glacier is losing?
There are three ways, from the simplest to the most useful:
- a.Length. Where does the glacier end? Old maps, photos and satellite pictures show its lowest point, the snout, moving back up the valley. Easy to see, but the snout can sit still while the ice above it grows thinner, and a glacier’s length reacts to the climate only slowly, over years or decades.
- b.Area. Satellite pictures show the outline of every glacier. That is how the whole of Nepal’s glaciers can be counted and measured at once.
- c.Mass. What really matters, for the water in Nepal’s rivers and the sea level, is how much ice is gained or lost. That is the glacier’s mass balance.
Income and spending
A glacier is like a bank account of ice. Its income is snow; its spending is melting (and, where it ends in a lake, ice breaking off).
High on the glacier, it is cold enough that more snow falls in a year than melts. This is the accumulation zone. Lower down, it is warmer, and more melts than falls: the ablation zone (ablation means taking away). Somewhere between them is a height where, over the year, the snow gained just equals the snow and ice lost: the equilibrium line. The ice flows slowly downhill, carrying the extra from the accumulation zone down to replace what melts below.
If the climate stayed the same, the glacier would settle at a size where the income exactly balanced the spending. In a warming climate, the equilibrium line moves up the mountain. The accumulation zone shrinks, the ablation zone grows, and the glacier spends more than it earns, year after year.
Stakes and snow pits
Scientists measure the mass balance with simple tools carried up on their backs.
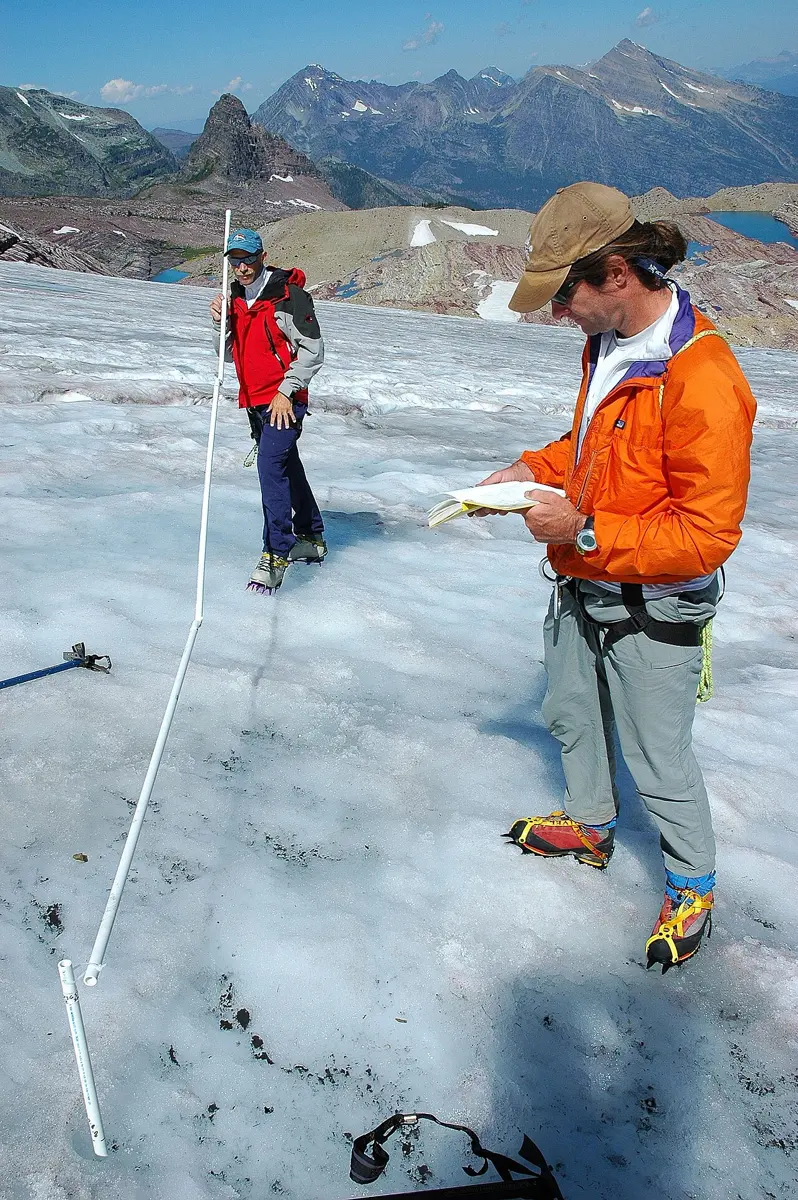
- a.In the ablation zone they drill holes several meters deep into the ice with a steam drill or a hand drill, and push in long bamboo or plastic stakes. A year later they come back and measure how much more of each stake sticks out: that is how much the ice surface has dropped.
- b.In the accumulation zone they dig snow pits and measure how deep the year’s snow is and how dense it is.
- c.Snow, firn (old, packed snow) and ice have very different densities, so everything is turned into the same unit: the depth of water it would make if melted, written m w.e. (meters of water equivalent). Ice is about 0.9 times as dense as water, so 1 m of ice is 0.9 m w.e.; fresh, packed snow might be 0.4 m w.e. per meter.
- d.The readings at each stake and pit stand for the area of the glacier around them. The average over the whole glacier, weighted by area, is its mass balance for the year. A negative number means it lost ice.
What the measurements show
Measured like this, Yala Glacier lost on average 0.80 m w.e. a year from 2011 to 2017, and in 2016/17 it lost 1.54 m w.e., the worst year. Mera Glacier, in the Everest region, has been measured every year since 2007. Satellites can now weigh thousands of glaciers at once, by measuring the height of the ice surface from space in different years. For the whole of the Hindu Kush Himalaya, ICIMOD’s 2023 report found that glaciers lost about 0.17 m w.e. a year in 2000–2009 and about 0.28 m w.e. a year in 2010–2019: 65% faster.
What a climate model is
Measurements tell us about the past and the present. To say anything about the future, scientists use climate models: computer programs that calculate how the air, the sea, the ice and the land will behave.
The world in boxes
A climate model divides the whole Earth into boxes, like a chessboard wrapped round the globe, with the air above each square cut into layers, 30 to 100 of them, up to 40 km or more above the ground, and the sea below cut into layers down to the ocean floor. In many of today’s models the boxes are about 100 km across, though some are coarser and some much finer.
For every box, the computer works out what happens in a short step of time, perhaps half an hour, using the laws you know from physics:
- Energy is conserved. Sunlight coming in, infrared going out, heat carried by air and water from box to box.
- Mass is conserved. Air, water and carbon moving from box to box are not created or destroyed.
- Newton’s laws of motion. Differences in pressure push the air and water, making winds and currents; the Earth’s turning bends them.
- Water changes state. Water evaporates from the sea, rises, cools, condenses into clouds and falls as rain or snow, giving out the heat it took in when it evaporated.
Then it takes the next step, and the next: about 17,000 steps for one model year, more than a million for a century. Running one model for a century can keep one of the world’s biggest computers busy for weeks.
Notice what the boxes can’t show. In one box 100 km across, the ground in Nepal may run from 1,000 m to 8,000 m, but the model sees only one height for the whole box. Its Himalaya are lower and smoother than the real ones, and its glaciers and steep valleys are hidden. So for Nepal, scientists downscale: they run a regional model with smaller boxes, 10–50 km across, over South Asia only, fed at its edges by the global model; or they correct the global model’s numbers against the records of Nepal’s own weather stations.
Some things are smaller than any box: a single cloud, a thunderstorm, the turbulence of air over a forest. These are worked out on average, from rules called parameterizations, tested against measurements. Clouds are the hardest; they are the main reason different models give different answers (they are the uncertain feedback in Can One Change Set Off Many More?).
Testing a model on the past
A model is trustworthy only if it gets things right that it wasn’t told. The best test is the past: start a model in 1850, give it only what changed (the Sun’s brightness, the volcanic eruptions, the greenhouse gases and the pollution people released), and see if it draws the temperature record by itself. This is called a hindcast. It can also answer a question no measurement can: what would have happened if people had added nothing?
With natural causes alone, the model stays near zero: the Sun has hardly changed since 1950, and volcanoes only cool the world for a year or two after each big eruption (Krakatoa in 1883, Agung in 1963, Pinatubo in 1991). Only when it feels what people have done does the model follow the record. The world’s big climate models, run the same way, give the same answer, and so the IPCC concluded in 2021 that it is “unequivocal”, beyond any reasonable doubt, that human influence has warmed the world.
In a hindcast, a model is given only the natural causes (the Sun and volcanoes) and fails to warm like the record since 1950. Given the human causes as well, it matches. What does this show?
Pick an answer to see why.
Paths into the future
A model can calculate what the climate will do with any amount of greenhouse gas. But nobody knows how much people will release, because that depends on choices not yet made: how fast countries switch to clean electricity, how people travel, how many forests are cut or planted. So scientists don’t make one forecast. They make a set of scenarios: “if people do this, the climate will do that.”
The IPCC’s 2021 report used five main scenarios, named Shared Socioeconomic Pathways (SSPs). SSP1 is a world that works together on sustainability; SSP2 carries on roughly as now; SSP3 is divided, with countries competing; SSP5 grows fast on fossil fuels. The second number is how hard the gases push on the climate by 2100, in W/m²: 1.9 is a very small push, 8.5 a very large one.
| Scenario | In words | 2021–2040 | 2041–2060 | 2081–2100 |
|---|---|---|---|---|
| SSP1-1.9 | very low: CO₂ emissions reach zero around 2050 | 1.5 (1.2–1.7) | 1.6 (1.2–2.0) | 1.4 (1.0–1.8) |
| SSP1-2.6 | low: zero around 2070 | 1.5 (1.2–1.8) | 1.7 (1.3–2.2) | 1.8 (1.3–2.4) |
| SSP2-4.5 | middle: about today’s level until 2050, then falling | 1.5 (1.2–1.8) | 2.0 (1.6–2.5) | 2.7 (2.1–3.5) |
| SSP3-7.0 | high: doubling by 2100 | 1.5 (1.2–1.8) | 2.1 (1.7–2.6) | 3.6 (2.8–4.6) |
| SSP5-8.5 | very high: doubling by 2050 | 1.6 (1.3–1.9) | 2.4 (1.9–3.0) | 4.4 (3.3–5.7) |
The numbers are warming in °C compared with 1850–1900, averaged over each 20 years: the IPCC’s best estimate, then the range it judged very likely (at least a 90% chance of being right). They come not from one model but from dozens, checked against how well each has matched the measured warming.
Read the table and the widget like a scientist:
- The next 15 years are almost decided. In 2021–2040 every path gives about 1.5 °C. The gases already in the air, and the time the sea takes to warm, mean the warming of the next two decades is mostly locked in.
- By the middle of the century, the paths split. By 2041–2060 the very low path holds near 1.6 °C; the very high one reaches 2.4 °C.
- By the end of the century, choices matter most. The paths range from 1.4 °C, falling back, to 4.4 °C, still rising.
Warming follows the total carbon dioxide
There is a simple rule behind the scenarios. The warming the world reaches depends on the total carbon dioxide people have released since 1850, added up over all the years: each 1,000 billion tonnes of CO₂ adds about 0.45 °C (likely between 0.27 and 0.63 °C), the IPCC found. So the world has a carbon budget: a total amount it can release before reaching a given warming. Once it is spent, emissions have to stop for the warming to stop.
How sure can we be?
Every forecast has an uncertainty. A good forecast says how big it is. In a climate forecast it comes from three different places:
- a.Natural wobbles. El Niño, La Niña and volcanic eruptions push the temperature up or down for a year or two. No one can say which years they will come, so a forecast for any single year, or even a single decade, has a spread of a tenth or two of a degree. Over 20-year averages, these mostly cancel.
- b.The models. Models don’t all agree on how much the Earth warms for a given push, mostly because of clouds. That is why each box in the widget has a height.
- c.What people do. The choice of scenario. Science can’t forecast this part: it is up to people.
Which one matters most depends on how far ahead you look. For the next ten years, natural wobbles and model differences are the biggest; the scenarios have hardly separated yet. By the end of the century, what people do is by far the biggest. So the further ahead the forecast, the more it depends on choices still being made, including those of your generation.
Why do the IPCC’s forecasts for 2021–2040 hardly depend on the scenario, while those for 2081–2100 depend on it a lot?
Pick an answer to see why.
What it means for Nepal
Hotter, faster in the mountains
Nepal is warming faster than the world’s average, and its high mountains faster than its plains. Snow and ice melting away leaves darker ground, which absorbs more sunlight: the ice–albedo loop from Can One Change Set Off Many More?. Global climate models scaled down to Nepal for its National Adaptation Plan (Ministry of Forests and Environment, 2019) project Nepal’s average temperature in 2036–2065 to be about 1.3 to 1.8 °C higher than in 1981–2010, depending on the scenario, and by 2071–2100 about 1.7 to 3.6 °C higher.
Hot extremes change most of all. The IPCC worked out how often a hot spell that used to come once in 10 years (in 1850–1900) comes as the world warms:
| World warming | How often a once-in-10-years hot spell comes | How much hotter it is |
|---|---|---|
| 1 °C (about 2010–2020) | 2.8 times in 10 years | 1.2 °C |
| 1.5 °C | 4.1 times in 10 years | 1.9 °C |
| 2 °C | 5.6 times in 10 years | 2.6 °C |
| 4 °C | 9.4 times in 10 years | 5.1 °C |
At 4 °C of warming, what used to be a once-in-a-decade hot spell would come almost every year, and be 5 °C hotter. In the Terai, where summer days already pass 40 °C, that is a danger to health, to farm work and to crops.
Rain
A warmer atmosphere holds more water vapor, about 7% more for every degree. The IPCC expects the South Asian monsoon to bring more rain over the century, but not evenly: heavy downpours, the kind that trigger floods and landslides on Nepal’s hills, become heavier and more common, while Nepal’s own projections show less rain in the hot, dry weeks before the monsoon. Rain is much harder to forecast than temperature, and the models disagree more about it; the direction (more heavy rain) is clearer than the amounts.
Ice and rivers
Grade 10 gave you ICIMOD’s forecast: the region’s glaciers could lose a third to a half of their ice by 2100 if warming is held to 1.5–2 °C, and up to 80% if emissions stay high. Two things about this forecast are worth thinking through.
First, glaciers respond slowly. A glacier is still shrinking from the warming of past decades; it has not caught up yet. So even on the lowest path, Himalayan glaciers will keep losing ice for decades. What the path decides is how much is left in the end.
Second, losing ice means more water in the rivers at first, then less. As a glacier melts faster, it gives more water each year, until it gets so small that, even melting fast, it gives less. The year of most meltwater is called peak water. For many Himalayan river basins, ICIMOD expects peak water around the middle of this century: about when you are grown up. After that, rivers fed by glaciers will carry less water in the dry months before the monsoon, when farms, towns and hydropower stations need it most.
And the sea
Nepal has no coast, but its neighbors do. About two-thirds of Bangladesh is less than 5 m above the sea, by its government’s estimate, and the deltas of the Ganga, Brahmaputra and Meghna, fed by Nepal’s rivers, are among the most crowded low places on Earth. The IPCC forecasts that by 2100 the sea will likely be 28 to 55 cm higher than in 1995–2014 on the very low path, and 63 cm to 1.01 m higher on the very high path. Unlike the temperature, sea level won’t stop rising when emissions stop: the deep sea goes on warming and expanding, and the great ice sheets go on melting, for centuries.
A glacier-fed river in Nepal carries more water in spring now than it did 30 years ago. What is the best explanation?
Pick an answer to see why.
Investigate: what changed in your family’s lifetime?
Questions
Which is a forecast about climate rather than weather?
Pick an answer to see why.
On the middle path, SSP2-4.5, the IPCC’s best estimate for 2081–2100 is 2.7 °C, with a very likely range of 2.1–3.5 °C. Which statement is right?
Pick an answer to see why.
Explain why scientists measure the world’s temperature as an anomaly, rather than averaging the temperatures themselves.
Answer
Temperatures differ hugely from place to place (a mountain summit and a lowland town the same day), and stations are spread unevenly and come and go. Averaging the temperatures themselves would give a number that changes whenever a station is added or closed. A station’s anomaly, its difference from its own usual temperature, is much more alike over large distances: a warm month is usually warm for a whole region. So anomalies can be averaged fairly over the whole Earth, and a change in the average shows a real change in the climate.
The world’s average temperature was 0.79 °C above pre-industrial in 1995–2004 and 1.26 °C in 2015–2024. a. Work out the rate of warming in °C per decade. b. If it continued at this rate, in what year would the warming reach 2.0 °C? c. Give one reason the real warming might reach 2.0 °C earlier or later than this.
Answer
- a.Warming = 1.26 − 0.79 = 0.47 °C over 20 years (the middles of the decades, about 2000 and 2020), which is 2 decades. Rate = 0.47 ÷ 2 = 0.235 °C per decade, about 0.24.
- b.To go: 2.0 − 1.26 = 0.74 °C. Time = 0.74 ÷ 0.235 = 3.1 decades, 31 years after about 2020: around 2051.
- c.Earlier: emissions might keep rising, or the cleaning up of air pollution, which used to reflect sunlight, might add warming (the rate over 2015–2024 was already about 0.27 °C a decade). Later: if emissions fall steeply, the rate slows, and on the very low paths the warming never reaches 2.0 °C at all.
A glacier has three measuring sites. Over a year, at the top a snow pit finds 2.0 m of new snow of density 450 kg/m³; in the middle, a stake shows the surface dropped 0.5 m of ice; at the bottom, a stake shows it dropped 2.4 m of ice. The three sites stand for 30%, 40% and 30% of the glacier’s area. (Ice: 900 kg/m³, water: 1,000 kg/m³.) a. Find the change at each site in m w.e. b. Find the glacier’s mass balance. c. Was the equilibrium line above or below the middle site? Explain.
Answer
- a.Top: 2.0 × 450 ÷ 1,000 = +0.90 m w.e. Middle: −0.5 × 0.9 = −0.45 m w.e. Bottom: −2.4 × 0.9 = −2.16 m w.e.
- b.Mass balance = 0.3 × 0.90 + 0.4 × (−0.45) + 0.3 × (−2.16) = 0.27 − 0.18 − 0.648 = −0.56 m w.e. The glacier lost ice.
- c.Above it. At the equilibrium line, the year’s gain equals its loss (zero). The middle site lost ice, so it was in the ablation zone, below the line; the top site gained, so the line was between the middle and top sites.
A climate model run with only natural causes (the Sun and volcanoes) shows almost no warming from 1950 to today. The same model run with natural and human causes shows about 1 °C, close to the record. a. Explain what this shows. b. Someone says: “The model was just tuned to match the record, so this proves nothing.” How would you answer?
Answer
- a.With the same physics, the model can produce the measured warming only when it is given what people added (greenhouse gases, minus the cooling from air pollution). Natural causes alone can’t: the Sun hasn’t brightened since 1950 and volcanoes cool the world for only a year or two. So the warming since 1950 is caused mainly by people.
- b.Models are built mostly from the laws of physics; the few numbers that are adjusted are set mainly to get today’s climate right (the pattern of rain, the sunlight reflected), not the warming. And the test doesn’t rely on one model or one record: many independent models agree, and they also get other things right that they weren’t tuned to, like the cooling of the stratosphere predicted by Manabe in 1967 and the warming of the deep ocean. Old models’ forecasts, made before the warming happened, matched it too.
Using the IPCC table, make an evidence-based forecast for the world when you are 40, about 2050. State the range of warming on the very low and very high paths, and describe two effects on Nepal you would expect at that warming. Say what part of your forecast is most uncertain, and why.
Answer
Around 2050 (2041–2060), the world will very likely be about 1.6 °C warmer than 1850–1900 on the very low path (very likely range 1.2–2.0 °C) and about 2.4 °C on the very high path (1.9–3.0 °C); the middle path gives 2.0 °C. Effects on Nepal at about 2 °C: hot spells that came once in 10 years before 1900 would come about 5–6 times in 10 years, and be about 2.6 °C hotter, harming health and crops in the Terai; Himalayan glaciers would keep shrinking and many glacier-fed rivers would be near or past peak water, with more water now but less in the dry season later; heavy monsoon downpours would be heavier, raising the risk of floods and landslides. Most uncertain: which path the world follows, because it depends on people’s choices, not physics; and, among the effects, the rain, because models agree less about rain than about temperature.
Why will Himalayan glaciers keep losing ice for decades even if the world stopped releasing greenhouse gases today?
Answer
Two reasons. The climate itself would stay warm: the warming caused so far doesn’t go away when emissions stop, because the carbon dioxide stays in the air for centuries. And glaciers respond slowly: a glacier is still adjusting to the warming of past decades, and has to shrink until its equilibrium line and its size fit the new climate, which takes decades. Stopping emissions stops the warming from getting worse; it decides how much ice is left in the end.
Where to go next
- Why Has the Climate Changed Before? The Earth’s energy balance, and how volcanoes, the Sun, the orbit and carbon dioxide changed the climate in the past.
- Can One Change Set Off Many More? The feedbacks, from melting ice to clouds, that decide how much the world warms for each push, and why the models’ ranges are as wide as they are.
- Where Does the Carbon Go? How much of the carbon dioxide we release stays in the air, and a model you can run of where it goes next.
- Which Energy Should Nepal Use? Costs, benefits and risks of Nepal’s ways of making electricity and cooking, and what each means for the climate.