
In the winter of 2015, Nepal ran short of energy twice over. The rivers were low, as they are every winter, so the electricity was cut for many hours a day. And from late September, during the protests over the new constitution, the trucks that bring petrol, diesel and cooking gas from India almost stopped crossing the border, for more than four months. Families queued through the night for one cylinder of gas. Buses stopped. People bought induction stoves, which were no use while the power was off, and went back to cooking on firewood.
Ten years later the picture is very different. The power cuts ended in 2018. In the monsoon Nepal now sells electricity to India and Bangladesh, and in 2024/25 about three in four new cars, jeeps and vans brought into the country were electric. But Nepal still spent about Rs 357 billion on imported petroleum that year, and in the dry months it still buys electricity from India.
So what should Nepal build next: more hydropower on its rivers, a big dam that stores water, solar panels, or none of these? And where should the sand and stone for all that building come from? Every answer has costs as well as benefits. This topic shows how engineers and planners weigh them, with numbers. Science can tell you what each choice will do. Which costs are worth paying is a choice that people have to make.
Where Nepal’s energy comes from
You met the sources of energy in Grade 9: renewable ones like sunlight, water, wind and biomass, and non-renewable ones like coal, oil and gas Grade 9: Grade 9: Sources of energy. You also learned how a hydropower station works Grade 9: Grade 9: Hydroelectricity, and the advantages of each source, one at a time.
Here is how much of each Nepal really uses. Count all the energy used in the country in a year, for cooking, heating, transport, factories and electricity, and in 2022/23 it came from:
| Source | Share of all the energy Nepal used (2022/23) |
|---|---|
| Firewood, crop waste and dung (traditional biomass) | 64% |
| Imported petrol, diesel, LPG, kerosene and coal | 26% |
| Electricity from the national grid | 7% |
| Solar, biogas and micro hydro off the grid | 3% |
Hydropower is Nepal’s pride, but grid electricity was only about one fourteenth of all the energy used. Most families in villages still cook on wood, and almost all transport runs on imported oil. So the question is not only “how should Nepal make electricity?” but also “what should run on electricity instead of wood and oil?”
In 2022/23, which supplied the largest share of all the energy used in Nepal?
Pick an answer to see why.
Costs and benefits
When a family chooses a stove, it thinks about more than one thing: what the stove costs, what the fuel costs each month, whether it smokes, whether the fuel can be bought when it is needed. A country choosing its energy does the same, on a bigger scale. The things it cares about are called its criteria. For energy they usually include:
- Money: what it costs to build, and what it costs to run, for each unit of energy.
- Pollution and climate: smoke in the air people breathe, and the greenhouse gases that warm the planet.
- Land and people: the land it covers, the forests cut, the families who have to move.
- Risk: what can go wrong, and how badly: a flood, a landslide, a fire.
- Reliability: whether it gives energy when it is needed: in winter, in the evening, during a border blockade.
- Self-reliance: whether the country controls it, or depends on another country.
No source is best at all of them. The cheapest may be the dirtiest; the cleanest may fail in winter. Giving up some of one thing to get more of another is a trade-off. Setting out every option’s costs and benefits, as far as possible in numbers, and comparing them, is called a cost–benefit analysis.
Engineers also separate two kinds of requirement. Some are constraints, which a solution must meet or it is rejected: “the lights must stay on on a winter evening”. Others are criteria to do as well as possible on: “as cheap as possible”. A diesel generator could keep every light on in winter, but at a price so high that no one would choose it.
What does a unit of electricity cost?
Electricity is sold by the unit, which is one kilowatt-hour (kWh): the energy a 1,000 W heater uses in one hour. (1 kWh = 1,000 W × 3,600 s = 3.6 million joules.) To compare a hydropower station with a solar farm fairly, you need the cost of each unit each one makes, not the cost of building it.
Two things decide it. The first is what the station costs, spread over the years: to build it, a company or the government borrows money and pays it back with interest. A loan at about 10% interest, paid back over 25 to 50 years, costs roughly a tenth of the amount borrowed every year. On top of that come the running costs: staff, repairs, fuel if it burns any.
The second is how much electricity it really makes. A 1 MW station working at full power all year would make 1 MW × 8,760 hours = 8,760 MWh. None does. A run-of-river station makes less when the river is low; a solar panel makes nothing at night. The share of that maximum a station really makes is its capacity factor:
Then
This cost per unit, worked out over a station’s whole life, is what engineers call the levelized cost of electricity.
Now compare a diesel generator, which is what a factory, a hotel or a mobile-phone tower runs when the power is off. A generator makes about 3.5 kWh from each liter of diesel, and diesel cost about Rs 195 a liter in Kathmandu in mid-2026. The fuel alone costs Rs 195 ÷ 3.5 = Rs 56 a unit, more than ten times the cost from a river or the sun, before the generator is paid for.
A 1 MW solar plant and a 1 MW run-of-river plant are both called “1 MW”. Why does the hydro plant make about three times as many units in a year?
Pick an answer to see why.
Not only money
Two stations can make electricity at the same price and still be very different choices. Here are the other costs, measured.
Carbon dioxide
Hydropower and solar panels burn nothing, but making them does give out greenhouse gases: the cement for a dam, the steel and glass for panels, the trucks. The fair comparison counts everything over a station’s whole life, from mining its materials to taking it apart: its life-cycle emissions.
Coal gives out about 35 times as much as hydropower for each unit. So when Nepal sells hydroelectricity to India in the monsoon, it can replace coal power there; when it buys from India in winter, it takes in electricity with about 30 times the carbon of its own.
Land and people
Every source needs land. A run-of-river plant needs little: a small dam to turn the water into a tunnel, a powerhouse, a road. A storage plant needs a reservoir, a valley filled with water. The biggest planned in Nepal, the Budhi Gandaki project on the border of Gorkha and Dhading, would make 1,200 MW and hold back a lake of about 50 km². Its reservoir would cover the homes of about 3,560 households completely and affect more than 8,000 (as of 2026 it has not been built: most of the land has been paid for, and the government plans to start building in 2028, which would take about eight years).
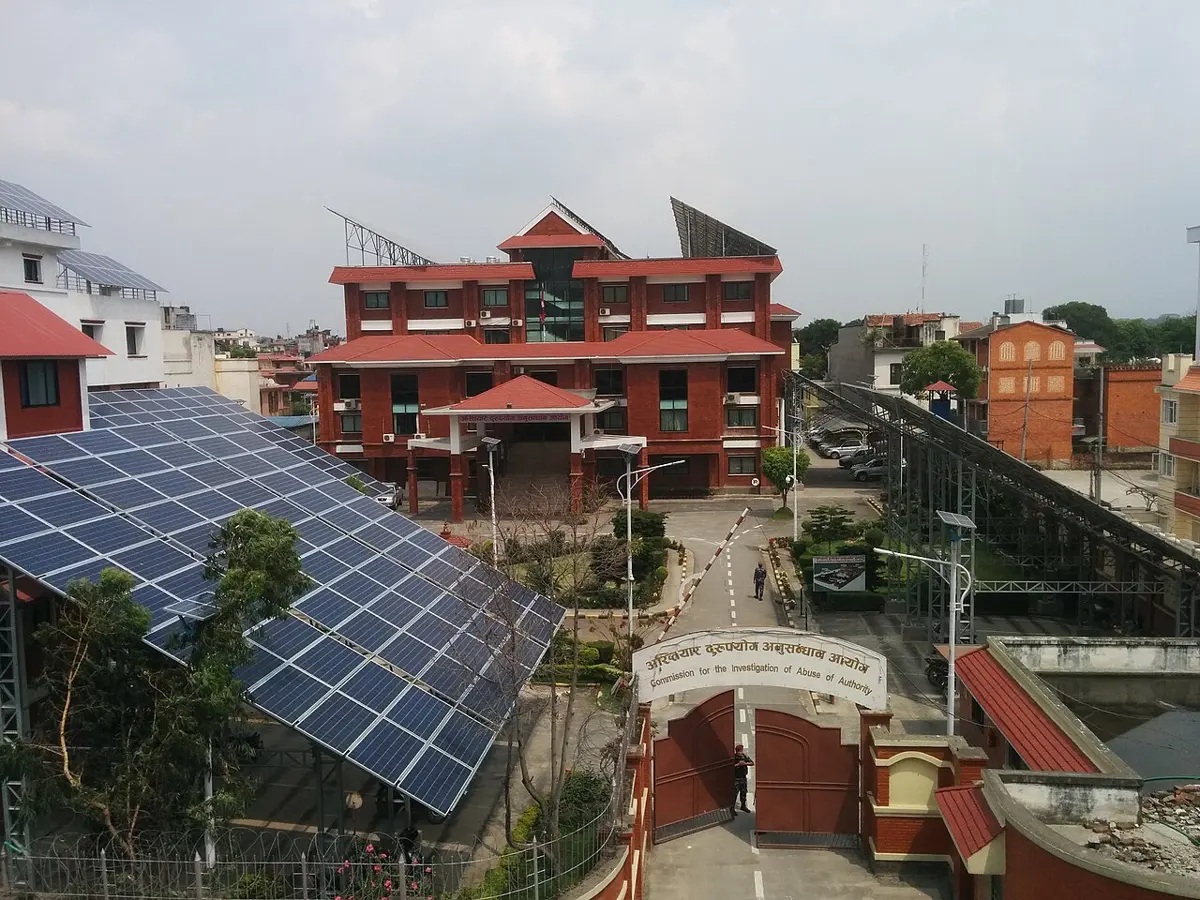
Solar farms need land too, about 2 hectares (20,000 m²) for each MW. Figure 43.2 compares the two for the same electricity in a year.
Surprisingly, they are about the same size. But the land is of a different kind. The reservoir floods a river valley: its farms, villages, forest and temples. Solar panels can go on dry, stony land, along canals, or on land already used, like the roofs of houses, schools and offices, where they need no new land at all.
Risk
Nepal’s rivers are steep, young and dangerous. On the night of 8 July 2025, a lake on a glacier in Tibet burst and sent a flood down the Bhotekoshi and Trishuli rivers in Rasuwa. It swept away the Friendship Bridge to China at Rasuwagadhi, destroyed the headworks of the 111 MW Rasuwagadhi hydropower plant, and damaged several others: about 200 MW of power was lost in one night. Thirteen months later, on 26 August 2026, an even bigger flood from Tibet came down the same valley. It killed hundreds of people, and the Nepal Electricity Authority reported about 430 MW of power stations cut off from the grid, among them Rasuwagadhi again, swept away completely. A hydropower plant in a Himalayan valley has to be designed for floods, landslides and earthquakes, and that adds to its cost.
Every source has risks of its own. A solar farm’s risks are small: a fire, a hailstorm. A dam that fails can drown the towns below it, so big dams are built to far stricter standards. Imported fuel has a different risk: that the supply stops, or the price jumps, for reasons outside the country, as in 2015.
Two power stations make the same number of units a year at the same cost per unit. One is a storage dam, the other a solar farm on dry land. Which statement is correct?
Pick an answer to see why.
Rivers in winter
Nepal’s rivers are fed by the monsoon and by melting snow. From June to October they are full; by February they have shrunk to a fraction of that. Most of Nepal’s hydropower is run-of-river: it has no big reservoir, so it can only use the water flowing past each day. In the dry season, run-of-river plants often make less than 40% of their rated power, while people use as much electricity as ever, more on cold evenings.
You can see what that is worth in the prices. For years the Nepal Electricity Authority has paid run-of-river plants Rs 8.40 a unit in the dry season and Rs 4.80 in the wet season. A unit in winter is worth almost twice as much, because it is scarce.
That is why Nepal both sells and buys electricity. In the year 2025/26 it sold electricity worth about Rs 29.3 billion to India and Bangladesh, nearly all in the monsoon, and bought electricity worth about Rs 10.6 billion from India, nearly all in the dry season.
Spring in Nepal is sunny and dry, and solar panels make most just when the rivers make least. So solar and run-of-river hydropower suit each other. But look at what the model can’t show: these are monthly averages. Nepal uses most electricity on winter evenings, between about 6 and 9 pm, after the sun has set. Solar panels cover the day; the evening needs water stored in a reservoir, batteries charged by day, or electricity from India. Batteries are getting cheaper every year, so solar plus batteries is becoming another way to cover the evening.
The model also keeps Nepal’s use fixed at 2025’s. In fact Nepal uses more electricity every year, as more people cook on induction and drive electric cars. A dam like Budhi Gandaki, if building starts in 2028, would not be finished until the mid-2030s, and by then the dry-season gap it was meant to fill will have grown. One dam alone will not close it.
Cooking and traveling: oil or electricity?
The same reasoning works for a single family. Which is cheaper for cooking: LPG or an induction stove? The trick is to compare the energy that reaches the pot. An LPG flame heats the air around the pot as well, and only about half of the gas’s energy gets into the food. An induction stove heats the pot itself, and about 85% of the electricity’s energy gets in. That share is the stove’s efficiency.
An induction stove costs about Rs 5,000 to Rs 6,000, and the family may need new flat-bottomed steel pots, because induction only heats pots that a magnet sticks to. Is it worth it? Two simple measures help:
- The payback time is how long the savings take to pay back the extra cost: extra cost ÷ saving per year.
- The benefit–cost ratio is the total benefit over some years divided by the total cost. If it is more than 1, the benefits are bigger than the costs.
Weighing it all up
Now put the evidence together. Here is what the earlier sections found, for four ways Nepal could get more electricity:
| Run-of-river hydro | Storage dam | Solar farms | Buying from India | |
|---|---|---|---|---|
| Cost per unit | about Rs 4–8 | about Rs 13 (Question a) | about Rs 4–6 | the market price in India, dearer at peak hours |
| CO₂ (g per kWh) | about 24 | about 24, more if the reservoir floods forest that rots | about 48 | about 730 (mostly coal) |
| Land and people | little land; the river below the dam is left with less water | floods a valley: about 50 km² and 3,560 homes for Budhi Gandaki | about 2 ha per MW; none on roofs | none in Nepal |
| Winter and evenings | falls to about a third in winter | any month, any hour | sunny winter days; nothing at night | if India has power to spare and the lines are free |
| Self-reliance | Nepal’s own | Nepal’s own | Nepal’s sunshine; the panels are imported | depends on another country |
How do you choose? One way engineers use is a decision matrix. Give each option a score for each criterion, from the evidence. Then decide how much each criterion matters, its weight, and add up the weighted scores.
The scores are where science comes in: measured costs, emissions, areas, river flows. The weights are not science. They are values: how much do you care about the families in the valley compared with the lights on a winter evening? Different people will honestly choose different weights, and should be able to see what each choice of weights leads to.
Try it. With every criterion weighted equally, run-of-river hydro comes first and solar a close second. If winter and evenings matter most, the storage dam wins. Only if using no land in Nepal matters far more than anything else does buying from India come first. Notice which options stay near the top whatever you choose: they are the safe choices. And notice that the real answer is usually not one option but a mix: run-of-river and solar for cheap clean units, some storage for winter evenings, and trade with neighbors for the rest.
Two planners use the same evidence about a storage dam, but one recommends it and the other does not. What is the most likely reason?
Pick an answer to see why.
Sand, stone and metal
Every power station, road and house is built of materials dug from the ground. The questions are the same as for energy: which source, at what cost, and can it last?
Sand and gravel
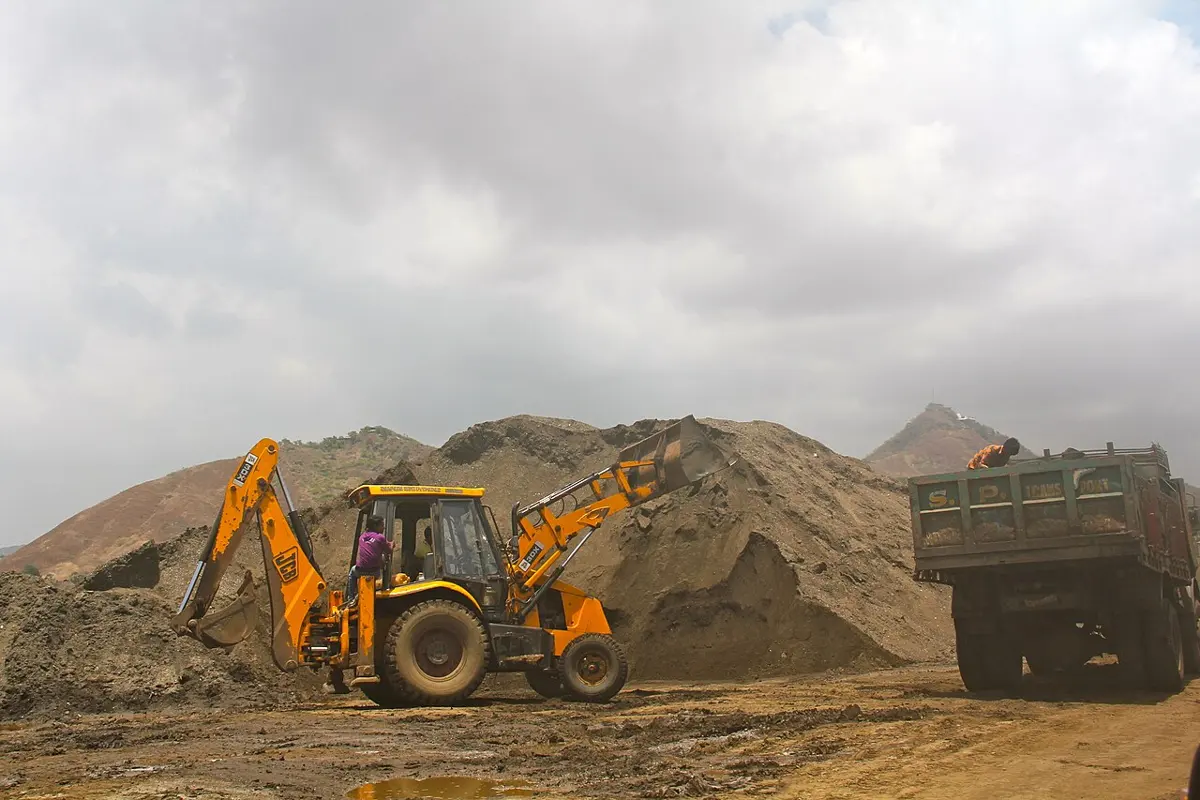
Concrete is about seven-tenths sand and gravel, by volume. The world now uses about 50 billion tonnes of sand and gravel a year, about 17 kg for every person every day, more than any other solid material we take from the Earth. In Nepal nearly all of it comes from three places:
- Riverbeds. Rivers bring sand and gravel down from the mountains, already washed and sorted by size. It is the cheapest source: dig it out, load it on a truck.
- The Chure hills (the Siwalik range), the lowest hills above the Terai. They are made of young, weak rock and loose gravel, easy to dig and easy to wash away. Their slopes soak up the rain that feeds the ground water of the Terai below them.
- Quarries in hard rock, crushed to size in crushers. The rock lasts longer as a resource, but it costs more to blast, crush and carry.
Is river sand renewable? Partly. Each monsoon, floods bring new sand and gravel down into every stretch of a river. That is the replenishment. If people take out no more than that, the river refills the pits and the riverbed stays where it was. If they take out more, the bed sinks a little more every year.
A sinking riverbed does harm far from the pit. The water table beside the river sinks with it, so wells and springs dry up. The fast water digs under the foundations of bridges and embankments. In Kathmandu, sand was dug from the Bagmati until, in the late 1980s, the bridge at Thapathali between Kathmandu and Lalitpur collapsed; the government then banned digging near bridges. Nepal’s rules today ban digging in the Chure hills and in the monsoon months, and keep it away from bridges, highways and settlements, but illegal digging is common.
Metals: use them again
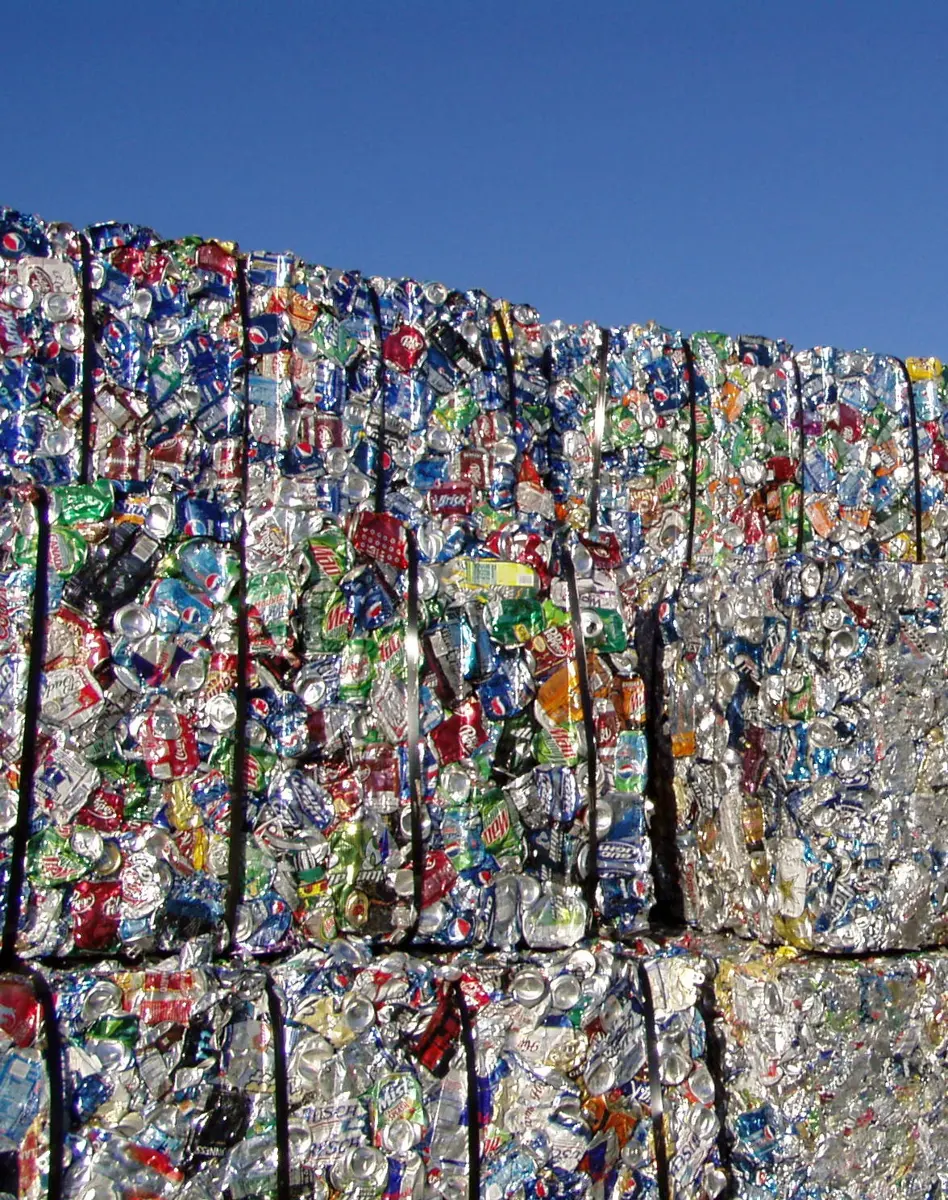
Aluminium, copper and steel are made from ores dug from the ground: Nepal has very little of any that is worth mining (you met Nepal’s minerals in Grade 8: Minerals in Nepal). But a metal is not used up when a pot or a wire wears out. It can be melted and made into something new, again and again, and that takes far less energy than making it from ore:
| Metal | Energy saved by making it from scrap instead of ore (roughly) |
|---|---|
| Aluminium | 95% |
| Copper | 85% |
| Steel | 60–75% |
Recycling also leaves the ore in the ground for later, and keeps mines, waste heaps and smelter smoke away. In Nepal, the kabadi collector who buys old cans, wires and pots by the kilo is a recycling industry: the scrap goes on to furnaces that melt it down.
The cheapest and cleanest unit of energy, and kilogram of metal, is often the one you don’t need. A 10 W LED gives as much light as a 60 W filament bulb. A well-insulated house needs less heating. Using less is part of every resource plan.
Questions
A 5 MW power station made 13,140 MWh in a year. What was its capacity factor?
Pick an answer to see why.
Why does the Nepal Electricity Authority pay a run-of-river plant Rs 8.40 for a unit in the dry season but only Rs 4.80 in the wet season?
Pick an answer to see why.
Budhi Gandaki is expected to cost about Rs 406 billion (as of 2026) and make about 3,383 GWh a year. Taking the yearly cost as 10% of the building cost for the loan plus 1% for running, work out its cost per unit. Why might Nepal build it even though its units cost more than Upper Tamakoshi’s Rs 4.2?
Answer
Yearly cost: 10% × Rs 406 billion + 1% × Rs 406 billion = Rs 40.6 billion + Rs 4.06 billion = Rs 44.7 billion (rounded).
Units: 3,383 GWh = 3.383 × 10⁹ kWh.
Cost per unit: Rs 44.7 × 10⁹ ÷ 3.383 × 10⁹ kWh = about Rs 13 per kWh, about three times Upper Tamakoshi’s.
Nepal might still build it because its units come when they are worth most: its reservoir stores monsoon water, so it can make electricity in the dry season and on winter evenings, when run-of-river plants are low and Nepal otherwise buys from India. It would also make the run-of-river plants downstream more useful in winter. Against that are the cost, the valley flooded and the thousands of families who would have to move.
A hill village two days’ walk from the nearest road needs electricity for lights, phones and a small mill. It has a stream with a good drop, and sunny winters. It is choosing between a micro-hydro plant, solar panels with batteries, and a diesel generator. Compare them on at least four criteria and recommend one.
Answer
Cost per unit: micro hydro and solar are cheap once built; diesel costs Rs 50 or more a unit for fuel alone, and the fuel has to be carried for two days, which makes it dearer still.
Reliability: micro hydro runs day and night but gives less in the late dry season; solar gives power by day and through the batteries at night, less on cloudy monsoon days; diesel works whenever there is fuel.
Upkeep: micro hydro needs its canal cleared and its turbine looked after, which villagers can be trained to do; solar needs little, but its batteries must be replaced every several years; diesel needs fuel and engine repairs.
Pollution: diesel gives smoke and CO₂; the others almost none while running.
Power for the mill: a mill needs several kilowatts at once, which micro hydro gives easily and a small solar system can’t.
Recommendation: micro hydro, because the village has a stream with a good drop, it gives power day and night, and it can run the mill; perhaps with some solar panels for the late dry season. Diesel only as a backup, if at all. (Other answers are fine if they are argued from the criteria.)
A shop owner uses a 60 W filament bulb for 6 hours a day. A 9 W LED bulb gives the same light and costs Rs 250. Electricity costs Rs 12 a unit for the shop. a. How many units does the LED save in a year? b. What is the payback time? c. Why is saving energy often called the cheapest source of energy?
Answer
- a.Power saved: 60 W − 9 W = 51 W = 0.051 kW. Time: 6 h × 365 = 2,190 h. Units saved: 0.051 kW × 2,190 h = 112 kWh a year.
- b.Money saved: 112 kWh × Rs 12 = Rs 1,340 a year. Payback = Rs 250 ÷ Rs 1,340 per year = 0.19 years, about 10 weeks.
- c.A unit saved does the same job as a unit made, but needs no power station, no fuel, no land and no transmission line, and gives out no pollution. Here each saved unit cost Rs 250 ÷ 112 kWh in the first year alone, about Rs 2, cheaper than any power station, and the bulb goes on saving for years.
In a stretch of river 1.5 km long and 120 m wide, the floods bring about 18,000 m³ of sand and gravel a year. Licenses allow 25,000 m³ a year to be taken, but trucks counted at the site carry out about 54,000 m³. a. By how much does the bed sink each year, and in 15 years? b. Is the licensed amount sustainable? What amount would be?
Answer
- a.Area: 1,500 m × 120 m = 180,000 m². Taken beyond what the river brings: 54,000 − 18,000 = 36,000 m³ a year. Sinking: 36,000 m³ ÷ 180,000 m² = 0.2 m a year; in 15 years, 3 m.
- b.No: even the licensed 25,000 m³ is 7,000 m³ more than the river brings, so the bed would still sink by 7,000 ÷ 180,000 = 0.04 m a year (0.6 m in 15 years). A sustainable amount is at most the replenishment, about 18,000 m³ a year, and less in a dry year, when the floods bring less.
One tonne of aluminium made from ore needs about 15,000 kWh of electricity. A Nepali household uses about 100 kWh a month. How many households could the energy saved by recycling one tonne of aluminium supply for a month?
Answer
Saved: 95% × 15,000 kWh = 14,250 kWh. Households for a month: 14,250 kWh ÷ 100 kWh per household = about 140 households.
Nepal’s government wants more families to cook on induction stoves instead of LPG. Make a claim about whether this is a good plan for the country, and support it with at least three pieces of evidence from this topic. Say what must be true for the plan to work.
Answer
Claim: Cooking on induction instead of LPG is a good plan for Nepal, as long as the electricity is reliable at cooking times.
Evidence:
- a.Induction cooking costs a family about half as much as LPG for the same food (about Rs 1,070 against Rs 2,060 for a cylinder’s worth), with a payback time of under a year.
- b.All LPG is imported: about Rs 62 billion of it in 2024/25, so less LPG means less money leaving the country and less risk if supplies are cut, as in 2015.
- c.Electricity from Nepal’s hydropower gives out about 24 g of CO₂ per kWh over its life, far less than burning LPG.
- d.In the monsoon Nepal has more electricity than it uses.
What must be true: The power must be there when people cook, on winter mornings and evenings, when the rivers are low; so the plan needs more dry-season and evening supply (storage, solar with batteries, or imports), and stronger local wiring and transformers, since many stoves switched on at once load the lines. Families also need help with the first cost of the stove and pots.
Where to go next
- How Much Electricity Can a Small Stream Make? Work out the power of a stream from its drop and its flow, and design a micro-hydro scheme.
- Does the Fix Actually Work? How to test whether a solution to an environmental problem really does what it promises.
- What Will the Climate Be Like When You Are Grown Up? What the carbon from the world’s energy choices will do to the climate, and to Nepal’s glaciers and rivers.