
On 29 July 2026, Global Tiger Day, Nepal announced the result of its latest national tiger count: 429 wild tigers, up from 121 in 2009. Nepal has more than three and a half times as many tigers as it had seventeen years ago, one of the biggest recoveries of tigers anywhere. Chitwan National Park alone had 145.
But in the villages beside the parks, the news was mixed. Tigers walk out of the forest at night and take goats and buffaloes from their sheds. Sometimes they kill people: in the fifteen years from 2010 to 2024, tigers killed 141 people in Nepal, nearly half of the attacks in and around Chitwan. Some conservationists now say that Nepal’s forests are already holding about as many tigers as they can.
So can Nepal’s tigers keep on growing? If not, what stops them, and how many can a park like Chitwan hold? Ecologists answer this with numbers: counts of tigers, counts of the deer they eat, and models of how a population grows. This topic shows you how.
How fast have Nepal’s tigers grown?
You learned in Grade 10 how Nepal protects its wildlife, and how it counts its tigers about every four years with hundreds of camera traps Grade 10: Conservation of wildlife. Every tiger’s stripes are different, like a fingerprint, so the photos show which tigers are which. From how often the same tigers are caught again, statisticians estimate how many were never photographed at all. So each count is an estimate with a range: in 2018, for example, Chitwan’s count was 93, with a range of 89 to 102.
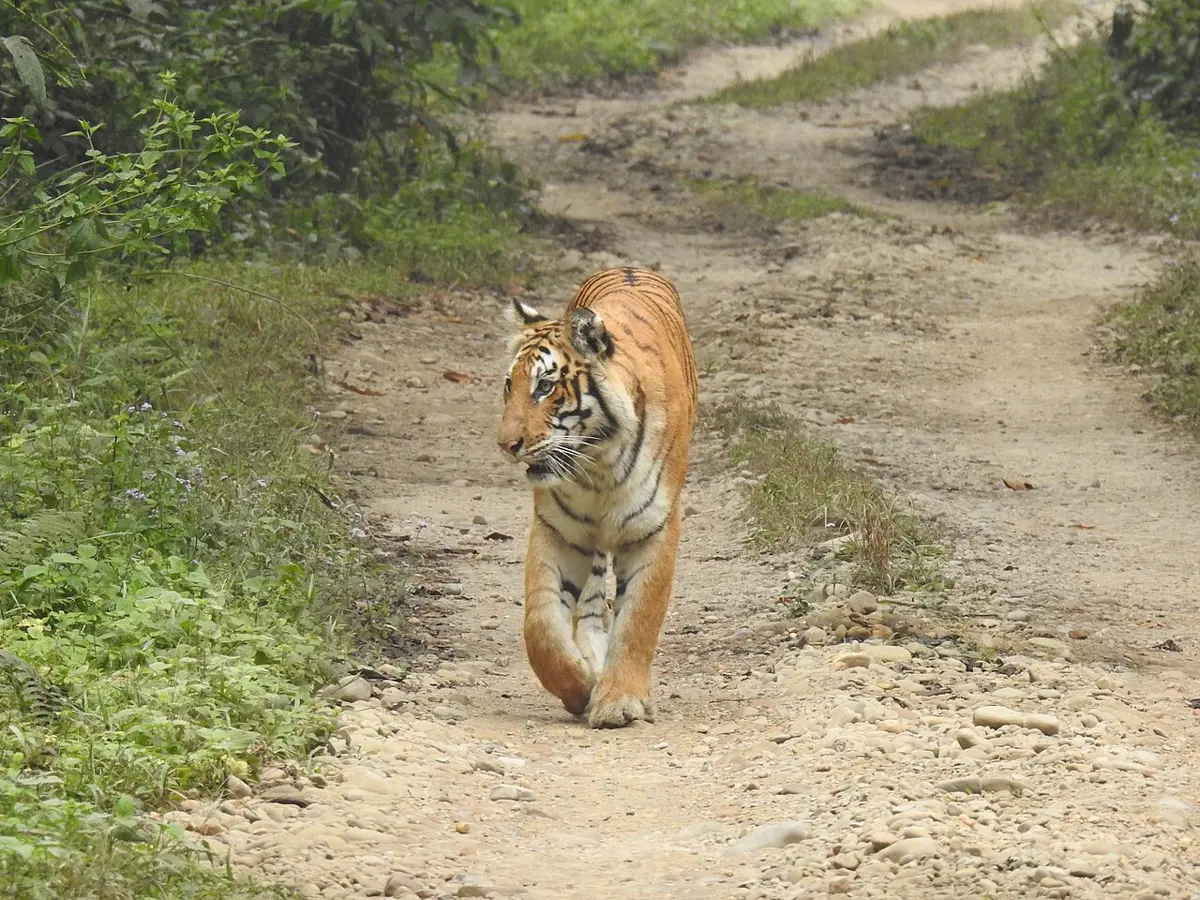
Here are the national counts, made by the Department of National Parks and Wildlife Conservation (DNPWC):
| Survey | Tigers in Nepal |
|---|---|
| 2009 | 121 |
| 2013 | 198 |
| 2018 | 235 |
| 2022 | 355 |
| 2026 | 429 |
A list of numbers doesn’t say much until you work something out from it. Two simple ways to compare one survey with the next are the change (how many more tigers) and the percentage change (how much more, compared with what there was before).
Put the four answers side by side and the growth looks bumpy: 64 %, then 19 %, then 51 %, then 21 %. Part of the bumpiness is real (good years and bad years for cubs, tigers poached, tigers walking across the border to India and back), and part comes from the counting: every count has a range, and the survey methods were improved between counts. So scientists don’t read much into one survey. They look for the trend over many.
Nepal’s tigers grew by 64 % between 2009 and 2013 and by 21 % between 2022 and 2026. Which statement do the numbers support?
Pick an answer to see why.
If nothing stopped them
Why should a population grow at all? You met Darwin’s answer in Grade 9: living things can produce many more young than they need to replace themselves Grade 9: Enormous fertility. A tigress has her first cubs when she is about three or four years old, usually two to four in a litter, and can have a litter every two years or so. Even if half her cubs die young, she can leave many more than two grown tigers in her lifetime.
When there is plenty of food and space, each tiger adds young at about the same rate, so the more tigers there are, the more cubs are born, and the faster the number climbs. Growth that adds the same percentage every year is called exponential growth. On a graph it curves upwards more and more steeply, in a shape like the letter J, so it is also called a J-shaped curve.
What stops a population growing?
Nothing grows exponentially for long. Every living thing needs things that are in short supply: food, water, space, shelter, a mate. As a population grows, each animal’s share gets smaller. You met this as competition in Grade 9 Grade 9: Competition and as the struggle for existence in Darwin’s theory. Anything that holds a population’s growth back is called a limiting factor.
For Chitwan’s tigers, the limiting factors include:
- Food. A tiger eats mostly spotted deer (chital), sambar, wild pigs, hog deer and barking deer. If there are more tigers than the deer can feed, tigers go hungry, have fewer cubs, and more cubs die.
- Space. Each tigress needs a home range of her own to raise cubs in, and a male guards a larger range that overlaps several females’. A young tiger that can’t find a free range must leave, or fight for one. Male tigers that take over a range often kill the cubs of the male before them.
- Boundaries. Chitwan is bordered by the Narayani river, farms, villages and roads. A young tiger pushed out of the park lands among people and livestock, and that is where most conflict happens.
- Climate and habitat. Floods in the monsoon, grasslands slowly turning into forest, and invasive plants such as the climber Mikania micrantha all change how many deer the land can feed.
- Disease, poaching and people kill tigers too.
Some of these factors get stronger as the population gets more crowded: more tigers means less food each, more fights and more tigers pushed out. These are called density-dependent factors, and they are what bring growth to a stop. Others, like a flood, hit a population whatever its size: density-independent factors.
When growth stops, the population has reached the most its area can feed and hold, year after year, without running down its own resources. That number is the area’s carrying capacity for that species, written K. It isn’t a fixed number for all time: if the habitat improves, K goes up; if it is damaged, K goes down.
Which of these is a density-dependent limiting factor for Chitwan’s tigers?
Pick an answer to see why.
Counting the food
If food is what limits tigers, then counting the food should tell us how many tigers a park can feed. In April and May 2019, scientists from Nepal’s DNPWC, the National Trust for Nature Conservation, the Zoological Society of London and others did exactly that in Chitwan and Parsa. Ten teams walked or rode on elephants along 320 straight lines, called line transects, across the plains and the hills, 605 km in all. Along each line they recorded every deer and wild pig they saw and its distance from the line. Animals far from the line are easier to miss, so from the distances a computer program works out how many must have been missed, and so how many animals live in each square kilometer: the density of prey.
| Prey animal | Chitwan (animals per km²) | Parsa (animals per km²) |
|---|---|---|
| Spotted deer (chital) | 51.95 | 13.96 |
| Sambar | 7.65 | 4.82 |
| Hog deer | 5.67 | none seen |
| Barking deer | 3.50 | 2.69 |
| Wild pig | 2.81 | 9.44 |
| All five | 71.58 | 30.91 |
Prey densities in 2019 (Dahal and others, Conservation Science and Practice, 2023). Each density is itself an estimate with a range; Chitwan’s total could be anywhere from about 49 to 105.
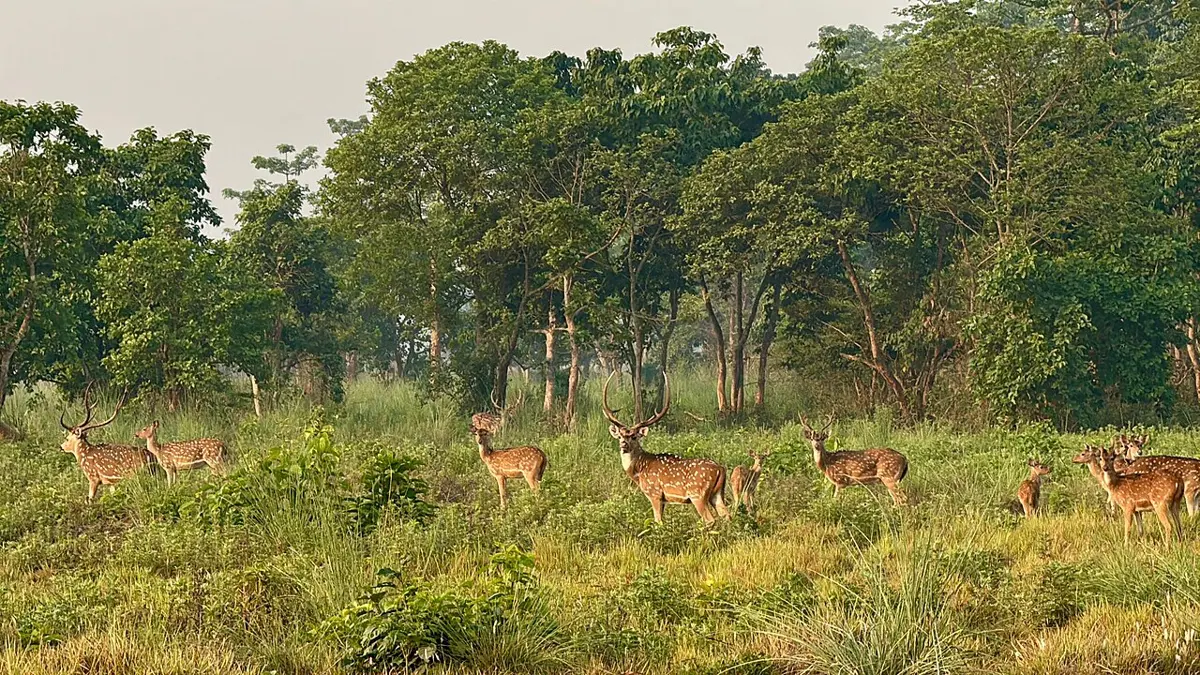
Now you need to know how many prey animals one tiger needs. From studies of tigers and their prey in India, the tiger scientist Ullas Karanth and his colleagues worked out a rule in 2004:
- A tiger kills about 50 large prey animals a year, roughly one a week.
- A healthy deer population can lose about 1 in 10 of its animals to tigers each year and still keep its numbers up, because births replace them.
- So each tiger needs about 50 × 10 = 500 prey animals living around it.
A second way: weigh the food
The same scientists checked their answer another way. Across all kinds of meat-eaters, from weasels to lions, the biologists Chris Carbone and John Gittleman found in 2002 that 10,000 kg of prey supports about 90 kg of predator. The scientists took an adult tiger in Nepal to weigh about 180 kg (males are often over 200 kg, females about 140 kg), so one tiger needs about 180 ÷ 90 × 10,000 = 20,000 kg of prey: roughly the weight of 570 spotted deer, at the 35 kg the scientists took for an average one (young ones included).
Testing the explanation
So the explanation is: Chitwan’s tigers are limited by their prey, and its prey can feed about 136 tigers. A good explanation must agree with new evidence. Here is the evidence from the counts.
Chitwan fits well. Its count dipped between 2013 and 2018 (120 to 93), which one pair of counts can’t explain on its own, since tigers walk to and from Parsa and India; then its tigers grew fast while there was room (8.3 % a year between 2018 and 2022), then slowly (3.2 % a year to 2026). The 2026 count, 145, is a little above 136 but well inside the range of 93 to 199. That is just what a population close to its carrying capacity should look like.
Parsa doesn’t fit. Its prey of 2019 could feed about 39 tigers, but 71 were counted in 2026. When the evidence and an explanation disagree, a scientist doesn’t throw away the evidence; she asks what the explanation has missed. Here there are several possible reasons, and the evidence can test each one:
- a.The prey has grown since 2019. Parsa’s villages were moved out of the park between 2009 and 2013, and its deer were still recovering when they were counted. More prey means a larger K. (A new prey survey would test this.)
- b.Tigers don’t stop at park borders. Chitwan and Parsa are one forest, 1,579 km² together. In 2026 the two parks had 145 + 71 = 216 tigers, against about 175 (117 to 264) for both parks’ prey together. Some “Parsa” tigers may hunt partly in Chitwan, or outside both parks.
- c.The rule is only roughly right. Tigers also kill gaur, nilgai, monkeys, porcupines and livestock, which weren’t counted as prey, and some tigers may kill more than one animal a week.
So the explanation survives, but revised: the prey limits the tigers, and Chitwan is close to its limit; Parsa’s limit has probably risen as its prey recovered, and the two parks’ tigers share one forest.
A model of growth that slows down
Ecologists describe a population that slows as it fills its habitat with a simple model, the logistic model. It was first written down in 1838 by the Belgian mathematician Pierre-François Verhulst. In words, each year:
new tigers = growth rate × tigers now × fraction of room still free
where the fraction of room still free is , with N the number of tigers now and K the carrying capacity. When there are few tigers, nearly all the room is free and the population grows almost exponentially. As N gets close to K, the free room shrinks to nothing and the growth stops. The curve rises slowly, then steeply, then levels off: an S-shaped curve.
Running the model year after year by hand is slow, so let a computer do it. The widget below runs the logistic model from Nepal’s 121 tigers in 2009 and draws it against the real counts.
Play with it and you will find something important. Models with a carrying capacity of 450, 500, 600 or 800 tigers all pass close to the five counts, each with its own growth rate (try 18 %, 16 %, 14 % and 11 % a year). Even exponential growth with no limit at all, at 8 % a year, misses the counts by only about 17 tigers on average. The models only disagree about the future: by 2050 they give anything from 450 tigers to nearly 3,000. Five counts on their own can’t tell you the carrying capacity. That is why ecologists count the prey as well: the prey survey is separate evidence about K that the tiger counts alone can’t give.
Tigers at three scales
In Grade 8 you saw that biodiversity can be looked at on different levels, from genes to whole ecosystems, and how much of it Nepal has Grade 8: Biodiversity. A population can be looked at on different scales too. Carrying capacity depends on the scale you look at, and so do the factors that matter most.
| Scale | Tigers | What limits them most |
|---|---|---|
| One park: Chitwan | 145 (2026) | prey, and home ranges inside the park’s borders |
| One country: Nepal | 429 (2026), in 5 parks | how much forest is protected, and whether tigers can move between parks |
| The world | about 3,700 to 5,600 (IUCN estimate, 2022) | tigers live in only a small fraction of the land where they once lived; poaching and the loss of forests and prey |
At the scale of the country, Nepal’s five tiger parks don’t all behave alike. Between 2022 and 2026, Banke’s tigers more than doubled (25 to 51) and Parsa’s grew by 73 %, while Chitwan’s grew by 13 % and Bardiya’s fell from 125 to 112. Parks still filling up grow fast; parks near their limit grow slowly or not at all. That is the logistic model again, park by park.
Nepal’s parks are also joined to India’s forests: Chitwan and Parsa to Valmiki Tiger Reserve, Bardiya to Katarniaghat, Shuklaphanta to Dudhwa. Forest corridors such as Barandabhar (between Chitwan and the hills) and Khata (between Bardiya and India) let young tigers walk to new home ranges instead of into villages. At this scale, keeping corridors open raises the carrying capacity of the whole landscape.
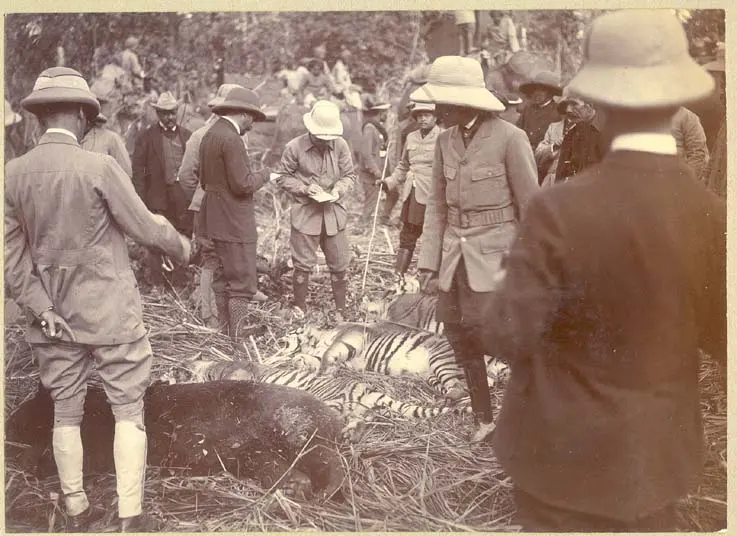
What can be done when a park is full?
When a population reaches its carrying capacity, there are only two kinds of choice: raise the carrying capacity, or live with the population at that size. Nepal is doing both.
- Raise K. Burn and cut the grasslands so they don’t turn into forest; clear invasive Mikania; make water holes in the dry Chure hills; protect the prey from poachers. More deer means room for more tigers.
- Join the habitat up. Protect corridors so tigers can reach parks that still have room, like Banke and Parsa.
- Help people live with tigers. Predator-proof sheds for livestock, compensation for animals and people killed, warnings when a tiger is near, and quickly moving a tiger that has started killing people. In 2026 Nepal was keeping 16 “problem tigers” in enclosures in Chitwan, Bardiya, Banke and the Central Zoo.
Questions
In the logistic model, when is the population growing fastest, in tigers added each year?
Pick an answer to see why.
A survey finds that a park’s spotted deer have halved after a disease, while the other prey stayed the same. What happens to the park’s carrying capacity for tigers?
Pick an answer to see why.
The table shows the tigers counted in each of Nepal’s five tiger parks.
| Park | 2022 | 2026 |
|---|---|---|
| Chitwan | 128 | 145 |
| Bardiya | 125 | 112 |
| Parsa | 41 | 71 |
| Banke | 25 | 51 |
| Shuklaphanta | 36 | 50 |
- i.Check that the parks add up to the national totals, 355 and 429.
- ii.Work out the percentage change for each park.
- iii.What was the average number of tigers per park in 2026?
- iv.Use your answers to (ii) to say which parks seem to be near their carrying capacity, and which still have room. What other evidence would you want before you were sure?
Answer
- i.2022: 128 + 125 + 41 + 25 + 36 = 355. 2026: 145 + 112 + 71 + 51 + 50 = 429.
- ii.Chitwan +17, +13 %; Bardiya −13, −10 %; Parsa +30, +73 %; Banke +26, +104 %; Shuklaphanta +14, +39 %.
- iii.429 ÷ 5 = about 86 tigers per park (but no park has close to 86: the average hides big differences, from 50 to 145).
- iv.Chitwan and Bardiya grew slowly or fell, as a population near its carrying capacity would; Banke, Parsa and Shuklaphanta grew fast, so they probably still have room. Before being sure, you would want each park’s prey density (to estimate K directly), the ranges of the counts (a fall of 13 might be within the counting error), and whether tigers moved between parks or were removed as problem tigers.
A forest of 400 km² has 45 prey animals per km². Using the rule of 500 prey animals per tiger, how many tigers can it feed? If good management raised the prey to 60 per km², how many more tigers could it feed?
Answer
45 × 400 = 18,000 prey animals; 18,000 ÷ 500 = 36 tigers. At 60 per km²: 60 × 400 = 24,000; 24,000 ÷ 500 = 48 tigers, so 12 more tigers. (Raising the prey by a third raises the carrying capacity by a third.)
India counted 2,967 tigers in 2018 and 3,682 in 2022. Nepal counted 235 and 355 in the same years. (i) Work out each country’s percentage change. (ii) India gained many more tigers than Nepal. Does that mean India’s tigers were growing faster? Explain.
Answer
- i.India: (3,682 − 2,967) ÷ 2,967 × 100 % = 715 ÷ 2,967 × 100 % = 24 %. Nepal: 120 ÷ 235 × 100 % = 51 %.
- ii.No. India gained 715 tigers and Nepal 120, but India started with more than twelve times as many. Compared with its size, Nepal’s population grew about twice as fast. To compare populations of different sizes, use the percentage change, not the number added.
Explain the difference between exponential growth and logistic growth. Sketch the shape of each on one graph of population against time, and mark the carrying capacity.
Answer
In exponential growth the population grows by the same percentage every year, so the more there are, the more are added: the curve gets steeper and steeper without end (a J shape). It happens only while resources are plentiful. In logistic growth the growth slows as the population uses up its resources: the curve starts like the exponential one, is steepest at half the carrying capacity, then levels off just under the carrying capacity K (an S shape). On the sketch, both curves start together; the J keeps rising past K; the S bends over and runs along under a horizontal dashed line at K.
A student says: “Chitwan had 145 tigers in 2026, more than the 136 its prey can feed. So the tigers must be starving.” Give two reasons why this conclusion goes further than the evidence.
Answer
- a.Both numbers are estimates with ranges: the carrying capacity is between about 93 and 199, so 145 may well be below the real carrying capacity.
- b.The prey was counted in 2019, seven years before the tigers; the prey may have changed since.
- c.The tigers don’t only eat the five counted prey animals (they also take gaur, monkeys, porcupines and livestock), and Chitwan’s tigers also hunt outside the park.
- d.A population near its carrying capacity doesn’t mean most tigers starve: it means the extra tigers can’t settle there, so they die young, have fewer cubs, or leave. (Any two.)
Nepal’s government wants to keep its tigers and keep people safe. Using the idea of carrying capacity, suggest one action that raises the carrying capacity of tiger habitat and one that reduces conflict, and explain how each works.
Answer
Raise K: manage the grasslands (cutting and controlled burning so they don’t become forest, and clearing invasive Mikania): grasslands feed spotted deer and hog deer, so more prey means more tigers can be fed. Protecting corridors also works: tigers can reach parks that still have room, so the whole landscape holds more.
Reduce conflict: build predator-proof sheds for livestock in the buffer zones, so young tigers pushed out of the park can’t easily take goats and buffaloes; pay compensation quickly so villagers don’t turn against the tigers; and move a tiger that has started to kill people.
Where to go next
- Where Does a Fallen Leaf Go? Why there are 500 deer for every tiger: energy is lost at every step of a food chain.
- Can a Forest Come Back? How ecosystems recover after damage, like Chitwan after the 1950s, and how people can help.
- Why Do Animals Live in Groups? Why chital live in herds and tigers live alone.