
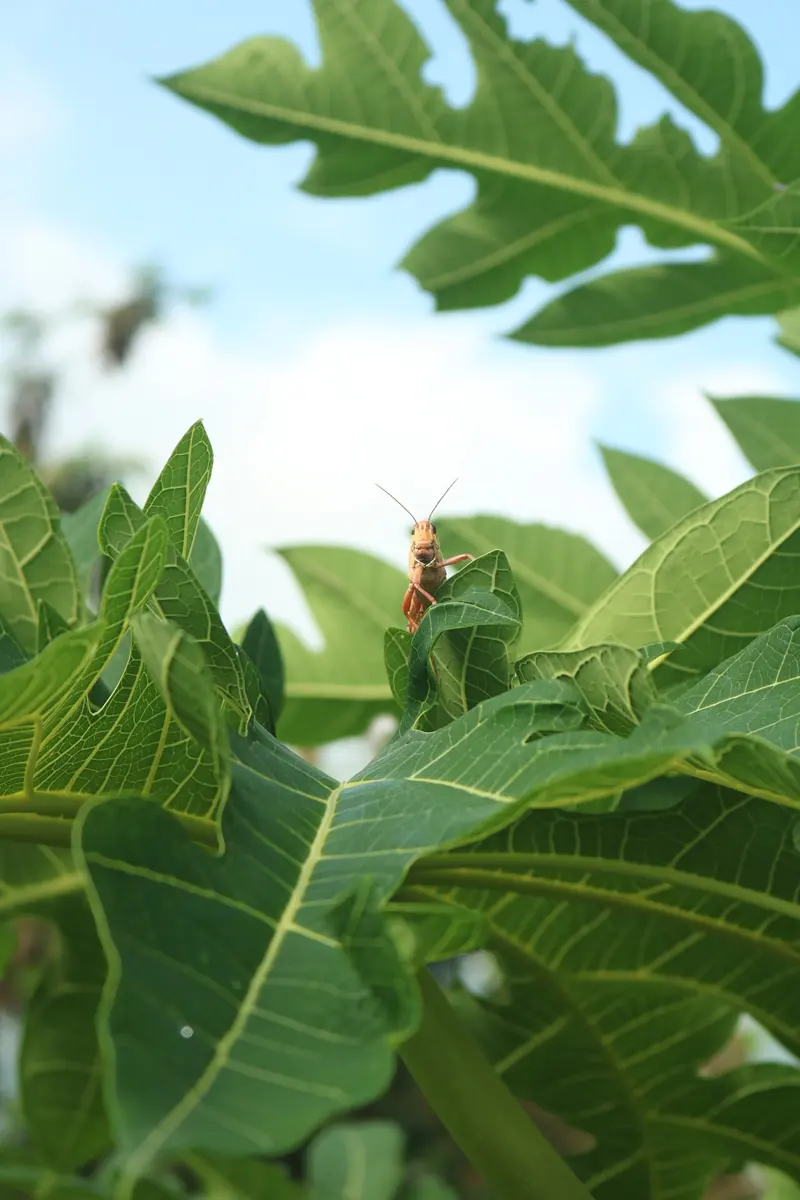
At the end of June 2020, farmers in Rupandehi, Parsa, Bara and Sarlahi looked up and saw the sky full of insects. Swarms of desert locusts, a kind of large grasshopper, had flown into Nepal from India. In a few days they had been seen in 24 districts, landing on maize, rice seedlings and trees, and eating the leaves.
Desert locusts live in the dry lands from the Sahara, across Arabia, to the Thar Desert of India and Pakistan. Most years there are not many of them, and they live alone, scattered across the desert. So where did so many come from? The story starts two years earlier, in 2018, when two cyclones brought heavy rain to the Empty Quarter, the great sand desert of southern Arabia. Plants grew where there had been only sand. The locusts had more food than they had had for a very long time, and their numbers exploded.
Plenty of food, and a population grows. Little food, and it shrinks. In this topic you will see how this works, for locusts, deer, rats, hares and Nepal’s own rhinos, and you will learn to read the graphs that show it, and to argue from them like an ecologist.
What makes a population grow or shrink
You learned in Grade 6 that an ecosystem is all the living things in a place together with their non-living surroundings: air, water, soil, sunlight. You meet it again in Grade 9, with its living (biotic) and non-living (abiotic) parts Grade 9: Components of an ecosystem.
Ecologists often look at just one kind of living thing in that place. All the living things of one kind (one species), living in one place at the same time, make a population: the rhinos of Chitwan National Park, the chital (spotted deer) of Bardiya, the fish in one pond, the fruit flies on one bunch of bananas. The number in it is the population size.
A population’s size changes in only four ways:
- a.animals are born, which adds to it;
- b.animals die, which takes away;
- c.animals arrive from somewhere else, which adds;
- d.animals leave for somewhere else, which takes away.
Think of it like a school. Its number of students next year is this year’s number, plus the new students who join, minus those who leave. A population works the same way:
So a population grows when more are born and arrive than die and leave. It shrinks when more die and leave than are born and arrive.
A population of monkeys has 60 babies born in a year, and 60 monkeys die. None arrive or leave. What happens to the population size?
Pick an answer to see why.
Food, water and room
Every animal needs certain things from its surroundings to stay alive and have young: food, water, shelter (a place to hide, sleep and raise young) and space. A plant needs light, water, nutrients from the soil and room (Why Do Two Plants From the Same Field Grow So Differently?). Anything a living thing needs and takes from its surroundings is a resource.
Resources are not always there in the same amount. The monsoon is good one year and weak the next. A field is full of grain before the harvest and bare after it. A fruit tree is loaded for a few weeks, then empty.
What happens to each animal
Start with one animal. What happens to it when food is plentiful, and when it is scarce?
| Plenty of food | Little food | |
|---|---|---|
| Growth | young grow fast and big | young grow slowly; adults get thin |
| Health | strong, able to fight off disease | weak, more often ill |
| Young | more young, and more of them survive | fewer young, or none at all |
| Survival | most live through the winter or dry season | the weakest die |
You may have seen this at home. A buffalo given too little fodder gets thin, and gives less milk. A hen fed well lays more eggs than one left to find scraps.
And so to the population
Now add up all the animals. When food is plentiful, more are born, more survive and fewer die: the population grows. When food is scarce, fewer are born and more die, and some leave to look elsewhere: the population shrinks.
This is the first big idea of this topic: the amount of a resource affects how each animal grows, and through that, how many animals there are. It is a chain of cause and effect:
more food → animals grow and breed well → more young survive → population grows
less food → animals grow less and breed less → more die → population shrinks
Darwin saw part of this in the 1800s: every kind of living thing has more young than its food can support, so they must struggle to live. You meet his idea in Grade 9 (Enormous fertility and Struggle for existence).
In a year when the grass grows well, a herd of deer gets bigger. Which is the best explanation?
Pick an answer to see why.
A tree keeps a diary
Trees show the effect of resources on growth in a way you can see with your own eyes. In places with one growing season a year, a tree’s trunk adds one layer of new wood each year: a growth ring. In a year with plenty of water, the tree grows a lot and the ring is wide. In a dry year, it grows little and the ring is narrow. Count the rings and you know the tree’s age; look at their widths and you can read which years were good and which were dry.
Scientists use real tree rings this way. Old trees in Nepal’s mountains carry a record of wet and dry years going back hundreds of years, from long before anyone measured the rain.
When the food suddenly appears
Back to the locusts. A desert locust lays its eggs in damp sand. In the dry desert, few of the eggs hatch, and few of the young find enough plants to grow up. But after heavy rain, the desert turns green, and almost all of them do. The UN’s Food and Agriculture Organization (FAO) says that in good conditions each new generation of locusts can be up to 20 times as many as the one before. A generation takes about three months.
Numbers can’t grow like that for long. The swarms eat the plants, the rain stops, the desert dries, and the locusts die or fly on. The population that rose so fast falls again. That is the pattern of the next section.
Booms and busts
A sudden rise is called a boom, and a sudden fall a bust. Booms and busts follow the food. But notice something about the timing: the rats kept growing for a while, and then crashed after the food ran out. A population often runs on past what its food can support, because the animals already born don’t vanish when the food does. They go on eating, and the fall comes later, and harder.
Try it more than once. A few things to notice:
- After a run of good years, the herd stops growing at a few hundred. There is only so much grass, and even in good years it gets shared out until each chital gets a little less than it needs.
- One dry year makes the herd fall, and a second dry year makes it fall again. The fall is biggest when the herd was biggest.
- When good years return, the herd grows back, at first fast (plenty of grass for few deer), then more slowly.
In a model herd, a dry year follows ten good years. When does the herd shrink the most?
Pick an answer to see why.
Reading a population graph
Ecologists show how a population changes on a line graph: time along the bottom (the horizontal axis), the number in the population up the side (the vertical axis). To read one:
- a.Read the axes first. What is counted, in what units, and over which years?
- b.Find the trend. Is the line going up (growing), down (shrinking) or level (steady)?
- c.Find the turning points. Where are the peaks (highest points) and the lows? When did the line change direction?
- d.Compare. If there are two lines, does one go up when the other does, or after it, or when the other goes down?
- e.Ask why. What changed in the surroundings around the turning points?
Hares and lynx
In the cold forests of Canada lives the snowshoe hare, which eats grass in summer and twigs and bark in winter. Its main hunter is a wild cat, the Canada lynx. For a lynx, hares are the main food: in winter, a lynx eats little else.
For well over a hundred years, trappers sold the furs of both animals to the Hudson’s Bay Company, which kept records of them. The number of furs bought each year is not the number of animals, but it rose and fell with how many there were. Figure Figure 15.3 shows those records for 1900 to 1920, as they are given in ecology textbooks.
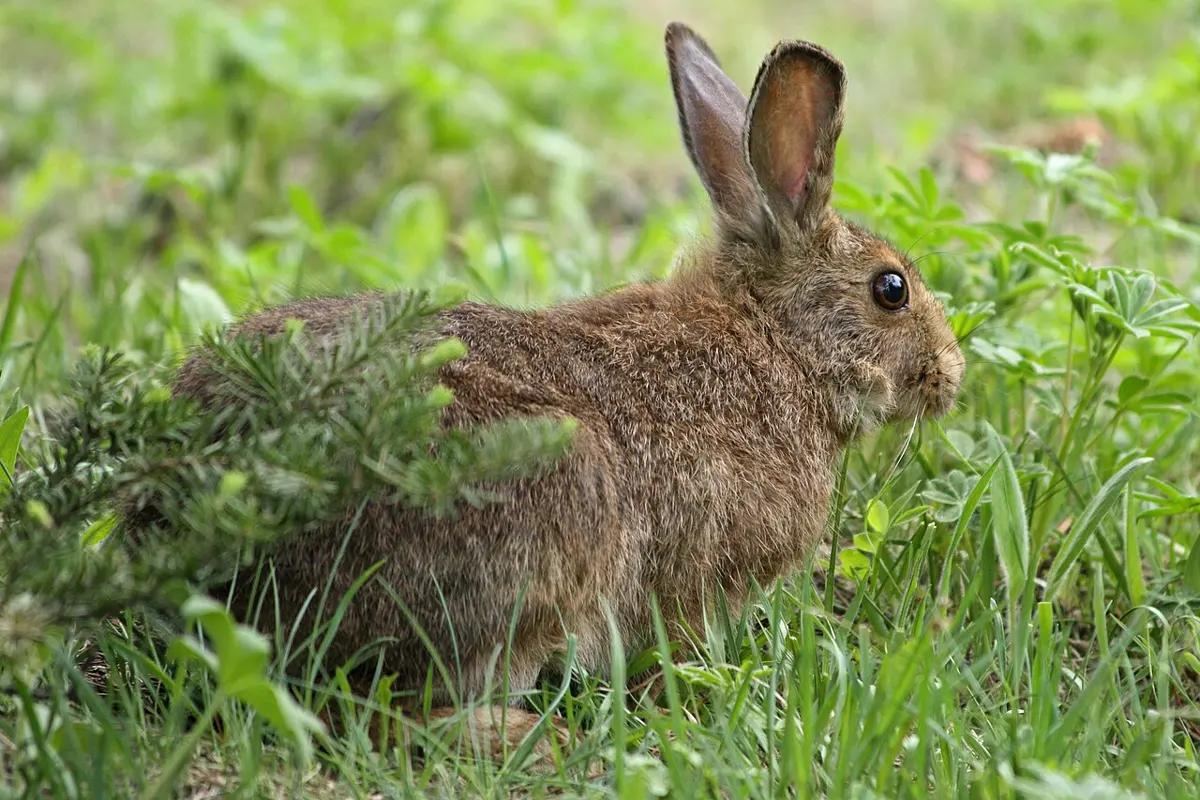
Read the graph. The hares rose to a peak in 1903, crashed by 1906, rose again to a peak in 1913, and crashed by 1917. The lynx did the same, but later: their peaks were in 1904 and 1915. That is just what you would expect if hares are the lynx’s food. With hares everywhere, lynx mothers are well fed and raise more kittens, so lynx numbers climb. When the hares crash, the lynx starve, and few kittens survive: a year or two later, the lynx crash too.
On a graph, the number of foxes rises a year or two after each rise in the number of rabbits they eat. What is the best explanation?
Pick an answer to see why.
When something in the ecosystem changes
So far the change was in food. But a population depends on every part of its ecosystem. A change in any of them can push its numbers up or down.
- Non-living (physical) parts: rain or drought, a flood, a fire, a hotter or colder climate, and the land itself: a grassland plowed into fields, a forest cut, a river dammed.
- Living (biological) parts: the plants an animal eats, the animals that hunt it, diseases, a new kind of plant or animal that arrives and spreads, and people, who hunt, farm and build.
You met many of these in Grade 8, as the causes of biodiversity degradation: deforestation, overgrazing, pollution, poaching, invasive plants and climate change Grade 8: Causes of biodiversity degradation. That list tells you what can harm a population. Now you will see how ecologists show, with numbers, that a particular change did.
Which of these is a change in a living part of a rhino’s ecosystem?
Pick an answer to see why.
Nepal’s rhinos: a population graph with a story
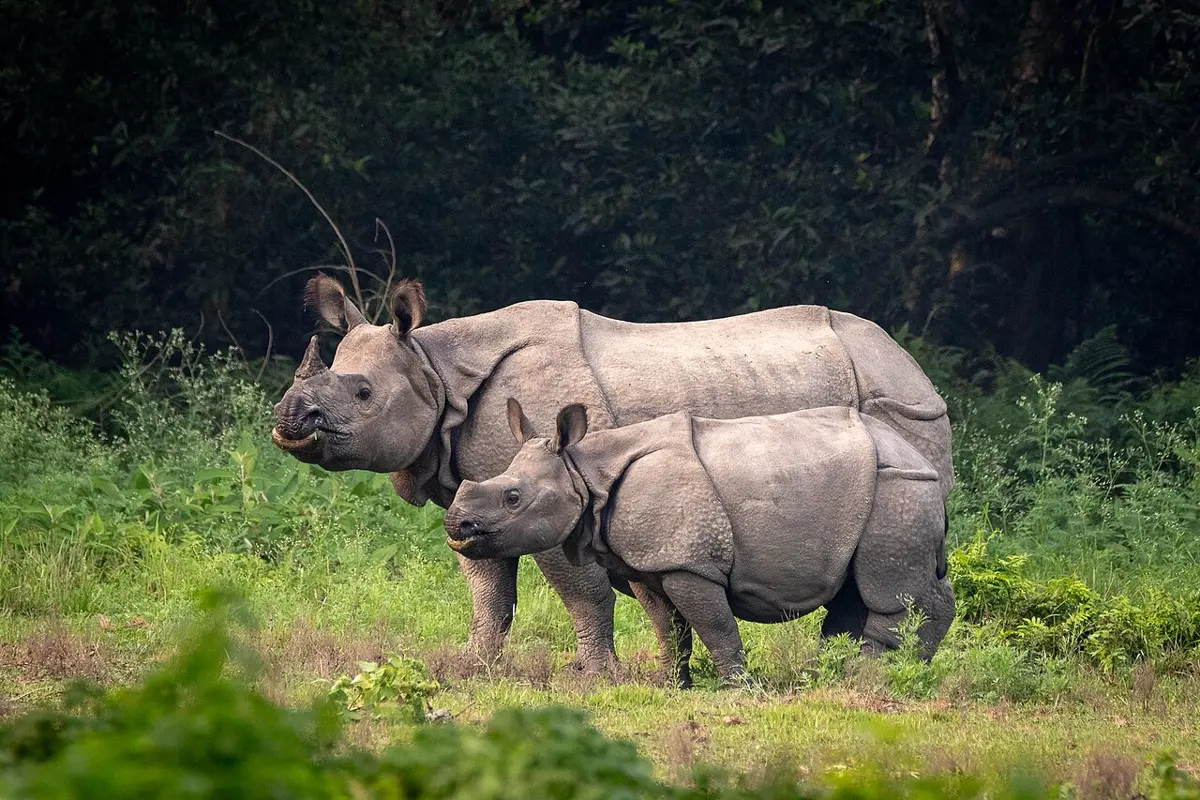
The greater one-horned rhinoceros lives in the tall grasslands and forests of the Terai, eating grass, leaves, twigs and fruit. Figure Figure 15.5 shows what is known about how many there have been in Nepal since 1950.
Here is what happened in each part of the graph.
- a.1950s and 1960s: the fall. Until the 1950s, malaria kept most people out of the Chitwan valley. When the disease was controlled by spraying with DDT, from the mid-1950s, settlers moved in and cleared much of the grassland and forest for farms. The rhinos lost most of their home, and poachers killed many for their horns. In about 18 years, the population fell from roughly 800 to about 100.
- b.1973 onwards: the rise. Chitwan became Nepal’s first national park in 1973, and from 1975 the army guarded it. The rhinos’ grassland was protected, and their numbers grew.
- c.1996–2006: a second fall. During the armed conflict, many of the army’s guard posts in the park were closed, and poachers killed dozens of rhinos. The count fell from 612 in 2000 to 409 in 2005.
- d.2006 onwards: the rise again. Guard posts were set up again and local young people joined anti-poaching patrols. Rhinos moved from Chitwan to Bardiya and Shuklaphanta (from 1986 onwards) had started new populations there. The count rose to 752 in 2021, the most since counts began. (As of 2026, that is still the latest national count.)
Making an argument from evidence
Suppose someone says: “The rhinos fell in the early 2000s because of poaching during the conflict.” How do you show that it is true, and not just a guess? Ecologists make a scientific argument in three parts, as you saw in Claim, evidence, reasoning:
- Claim: what you think is true. “Poaching during the conflict made Nepal’s rhinos fall between 2000 and 2005.”
- Evidence: data that support it. “The count fell from 612 in 2000 to 409 in 2005, during the conflict years. Before 2000 and after 2006 it rose.”
- Reasoning: why the evidence supports the claim. “Rhinos breed slowly (a mother has one calf every few years), so a fall of a third in five years needs many extra deaths. Poaching rose when the guards were moved away, and fell again when they came back. The timing fits.”
A good argument goes one step further. It asks: what else could explain the pattern? A flood? A disease? A drought? Then it looks for evidence that tells them apart. Here, park staff found rhino bodies with their horns cut off, and poachers were arrested with horns. A disease would not take the horns.
Weighing the evidence: the vultures
In Grade 10 you read how Nepal’s vultures nearly disappeared, and how a cattle painkiller, diclofenac, was found to be the cause Grade 10: Nepal’s success stories. Here is some of the evidence scientists had. Which pieces make the strongest argument?
- a.Counts of white-rumped vultures along roads in Nepal’s lowlands fell by about 91 % between 1995 and 2011.
- b.Dead vultures examined in Pakistan had kidney failure, and diclofenac was found in their bodies; vultures that died of other causes had none.
- c.In a test, captive vultures fed meat from cattle given diclofenac died of kidney failure.
- d.Nepal banned diclofenac for animals in 2006. From about 2013, white-rumped vulture numbers in Nepal began to rise again.
Which piece of evidence best shows that diclofenac causes vultures to die, and not just that the two happened at the same time?
Pick an answer to see why.
Questions
A pond has 200 frogs. In one year 150 tadpoles become frogs, 120 frogs die, 10 arrive and 40 leave. How many frogs are there at the end of the year?
Pick an answer to see why.
A tree’s rings are wide for five years, then narrow for three. What is the most likely reason for the narrow rings?
Pick an answer to see why.
The number of mice in a forest rises sharply in the year after oak trees make a huge crop of acorns. Which is the best explanation?
Pick an answer to see why.
Explain, step by step, how a weak monsoon could lead to fewer chital in a grassland a year later. Use the words resource, birth and death.
Answer
- A weak monsoon means less water, so the grass grows less. Grass is the chital’s main resource (food).
- With less grass to share, each chital eats less. Mothers grow thin and have fewer fawns, and fewer of the fawns survive: there are fewer births, and fewer young living to adulthood.
- Weak, hungry chital fall ill more easily, and more are caught by predators, so there are more deaths, especially of the young and old. Some chital may also leave to look for food elsewhere.
- With fewer births and more deaths, the population shrinks. Because fawns born (or not born) this year show up in next year’s count, the fall may be clearest a year later.
Here are made-up counts of a population of rabbits on an island, with the rain in each year.
| Year | Rain | Rabbits |
|---|---|---|
| 1 | good | 300 |
| 2 | good | 420 |
| 3 | good | 510 |
| 4 | very dry | 280 |
| 5 | good | 330 |
| 6 | good | 430 |
- a.Draw a line graph of the rabbits, with the years along the bottom.
- b.In which year did the population fall, and by what percentage?
- c.Write an argument, with a claim, evidence and reasoning, about what caused the fall.
- d.What other cause could explain it? What evidence would help you tell the two apart?
Answer
- a.Years 1 to 6 along the bottom, rabbits from 0 to 600 up the side, the six points joined by straight lines: up, up, sharply down, up, up.
- b.Between year 3 and year 4: 510 − 280 = 230. 230 ÷ 510 × 100 = 45 %.
- c.Claim: the dry year 4 made the rabbit population fall. Evidence: the rabbits grew every good year (300 → 420 → 510) and fell by 45 % in the only very dry year, then grew again when the rain returned. Reasoning: rain makes the grass grow, and grass is the rabbits’ food. With little rain, there was little grass for 510 rabbits, so fewer young were born and survived, and more rabbits starved.
- d.A disease, a new predator, or people hunting the rabbits in year 4 could also explain a fall. To tell them apart: look for dead rabbits and what killed them (thin and starved, or sick, or shot); measure the grass in year 4; check whether rabbit numbers on a nearby island with the same weather but no disease also fell.
Look at the hare and lynx graph (Figure 15.3). A student says, “The lynx made the hares crash.” Another says, “The hares crashing made the lynx crash.” Use the graph to say what each student has right, and what the graph alone can’t tell you.
Answer
- The second student is well supported by the graph: the lynx peaks (1904, 1915) come a year or two after the hare peaks (1903, 1913), and the lynx fall after the hares fall. Hares are the lynx’s main food, so when hares became scarce, fewer lynx kittens survived and lynx numbers fell. The timing fits cause and effect.
- The first student may be right too: when there are most lynx (1904–1905, 1914–1915), the hares are falling fastest, so lynx eating hares may be pushing them down. But the graph alone can’t show that the lynx caused it: the hares could also have been falling because they were short of food. It took an experiment (fencing out predators and giving extra food, in the Yukon) to show that both matter, and that most hares that die are killed by predators.
- The graph shows furs bought, not animals counted, so it shows the ups and downs, not the exact numbers.
In 2006 Nepal banned diclofenac for animals. A scientist wants to argue that the ban helped Nepal’s vultures. What evidence should she look for, and what other explanations should she rule out?
Answer
Evidence for: vulture counts before and after 2006 (the fall stopped and then, from about 2013, numbers rose); tests of cattle carcasses showing less diclofenac after the ban; fewer dead vultures with kidney failure; vultures doing best where the ban was best followed (vulture-safe zones).
Other explanations to rule out: vultures flying in from India (where diclofenac was also banned), more food for vultures (more dead cattle left out, as at the vulture restaurants), fewer vultures poisoned or killed in other ways, or a change in how the counts were made. If counts rose most where the cattle were free of diclofenac, and no other change happened at the same time, the argument is strong.
Rhino numbers in Nepal fell from about 800 in 1950 to about 100 in 1968. Name one physical change and one biological change in the rhinos’ ecosystem that caused this fall, and explain how each would reduce the number of rhinos.
Answer
- Physical change: loss of their land. When malaria was controlled, settlers cleared grassland and forest in the Chitwan valley for farms. The rhinos lost the grass and shelter they need, so fewer could find enough food and safe places to raise calves: fewer births, more deaths.
- Biological change: more killing by people. Poachers and hunters killed rhinos, for their horns and to protect crops. Each rhino killed is a death added; and a rhino has only one calf every few years, so the losses were made up only slowly.
(Malaria itself was a biological part of the ecosystem: removing it is what let the people, and the farms, in.)
Design an investigation to test the claim “More food means a bigger population of fruit flies.” Say what you would change, what you would keep the same, what you would measure, and what result would support the claim.
Answer
- Change: only the amount of food: for example 4 jars with 5 g of banana, 4 with 20 g and 4 with 40 g.
- Keep the same: the jar size, the kind and ripeness of the banana, the cloth cover, the place (same temperature and light), and how the flies got in (all left open outdoors on the same day, side by side, for the same time).
- Measure: the number of adult flies in each jar every two days for four weeks.
- Compare: the highest number (the peak) and how long the flies lasted, averaged over the 4 jars of each amount.
- Support for the claim: jars with more banana reach higher peaks and keep flies for longer, and the difference is bigger than the difference between jars with the same amount.
Where to go next
- Why Are There So Few Tigers? Why a forest can feed thousands of deer but only a few tigers: food webs, and how energy and matter pass from plants to the animals that eat them.
- What Is a Forest Worth? Forests clean water, hold soil and feed bees for our crops: how to compare ways of protecting them.
- Why Do Two Plants From the Same Field Grow So Differently? How light, water, nutrients and space decide how much one plant grows, and how to test it: read it.
Going further still: in Going Further, Grades 9–12, How Many Tigers Can Chitwan Hold? works out how many tigers a park’s deer can feed, and models how a population’s growth slows as it nears the most its home can hold.