
In many old neighborhoods of the Kathmandu Valley, the day starts with a queue. Before sunrise, people line up their plastic jars and buckets at the stone spout, the dhunge dhara, and wait for a thin stream of water to fill them one by one. Others wait for a tanker lorry, or pay for jars of drinking water. Yet the valley is not a desert: about 1,500 mm of rain falls on it in an average year, most of it in the monsoon.
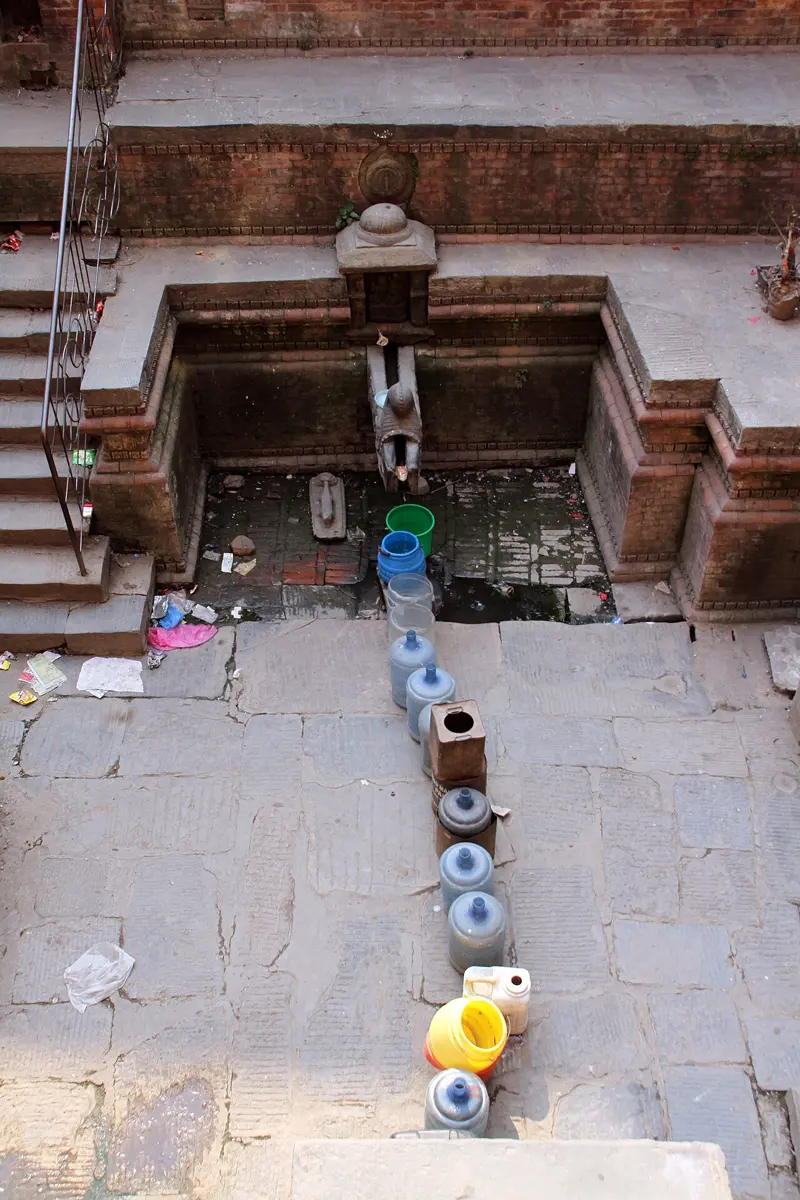
Under the valley, the water in the ground is being used up. Wells pump it out faster than rain soaks back in, by every estimate, and the water table has been falling since the 1980s. (Why rain refills the valley’s deep aquifers so slowly is in Groundwater in Nepal, in Why Is There Oil in Some Places but Not Others?) So the question this topic asks is a simple one, with a surprising answer: is it because there are more of us, or because each of us uses more? And how can you tell, from numbers, which matters more, for water, land and air?
One number times another
Start at home. Suppose a family of five each use about 50 liters of water a day, for drinking, cooking, washing, bathing and the toilet. How much does the family use?
5 people × 50 liters for each person = 250 liters a day.
That is the whole idea of this topic. Anything that people use, water, land, wood, fuel, electricity, adds up the same way:
total use = number of people × use per person
The use per person (scientists also say per capita, Latin for “per head”) is how much one person uses, on average, in a day or a year. Multiply it by the number of people and you have the total, which is what the land, the rivers and the air actually feel.
So a total can grow in two ways. There can be more people. Or each person can use more. Or both. You know from Grade 8 that a growing population and careless use of resources are among the causes of biodiversity loss Grade 8: Causes of biodiversity degradation, and that controlling population is one of the principles of sustainable development Grade 8: Principles of sustainable development. This topic shows how to measure each, and to argue from the numbers.
Now compare that with what the pipes bring. The Melamchi project carries water from the Melamchi River, beyond the hills to the north-east of the valley, through a tunnel 26 km long. With it running, KUKL received about 290 million liters a day in 2023: 170 million from Melamchi and 120 million from the valley’s own rivers, springs and deep wells (as of 2023). Every day the valley needs about 100 to 180 million liters more than the pipes bring. That gap is filled by private wells, tanker lorries and jar water, and almost all of it comes from the ground.
Notice two things. Doubling either side doubles the area. And a city of many people who each use a little can use the same total as a city of fewer people who each use a lot: the curve is full of different rectangles with the same area.
A town of 20,000 people uses 100 liters a person each day. Twenty years later it has 40,000 people, each using 150 liters. By how many times has the town’s total water use grown?
Pick an answer to see why.
More of us
Nepal’s population has grown, and the Kathmandu Valley’s much faster. The censuses counted:
| Census | Nepal | Kathmandu Valley (three districts) |
|---|---|---|
| 1971 | 11.6 million | 0.62 million |
| 1981 | 15.0 million | 0.77 million |
| 1991 | 18.5 million | 1.11 million |
| 2001 | 23.2 million | 1.65 million |
| 2011 | 26.5 million | 2.52 million |
| 2021 | 29.2 million | 3.03 million |
In fifty years Nepal’s population grew about 2.5 times, and the valley’s nearly 5 times. Most of the valley’s extra people weren’t born there: they moved in, from the hills and the Terai, for work, schools, hospitals and safety, especially during the conflict of 1996–2006. For the world’s population, and how fast it is growing, see How Many People Can the Earth Support? in Going Further, Grades 9–12 (Eight billion and counting).
More people need more homes, roads, schools and shops, and all of them need land. In a valley ringed by hills, that land can only come from fields and forests. Satellites have photographed the valley since the 1970s, and from their pictures scientists have measured how its land has changed.
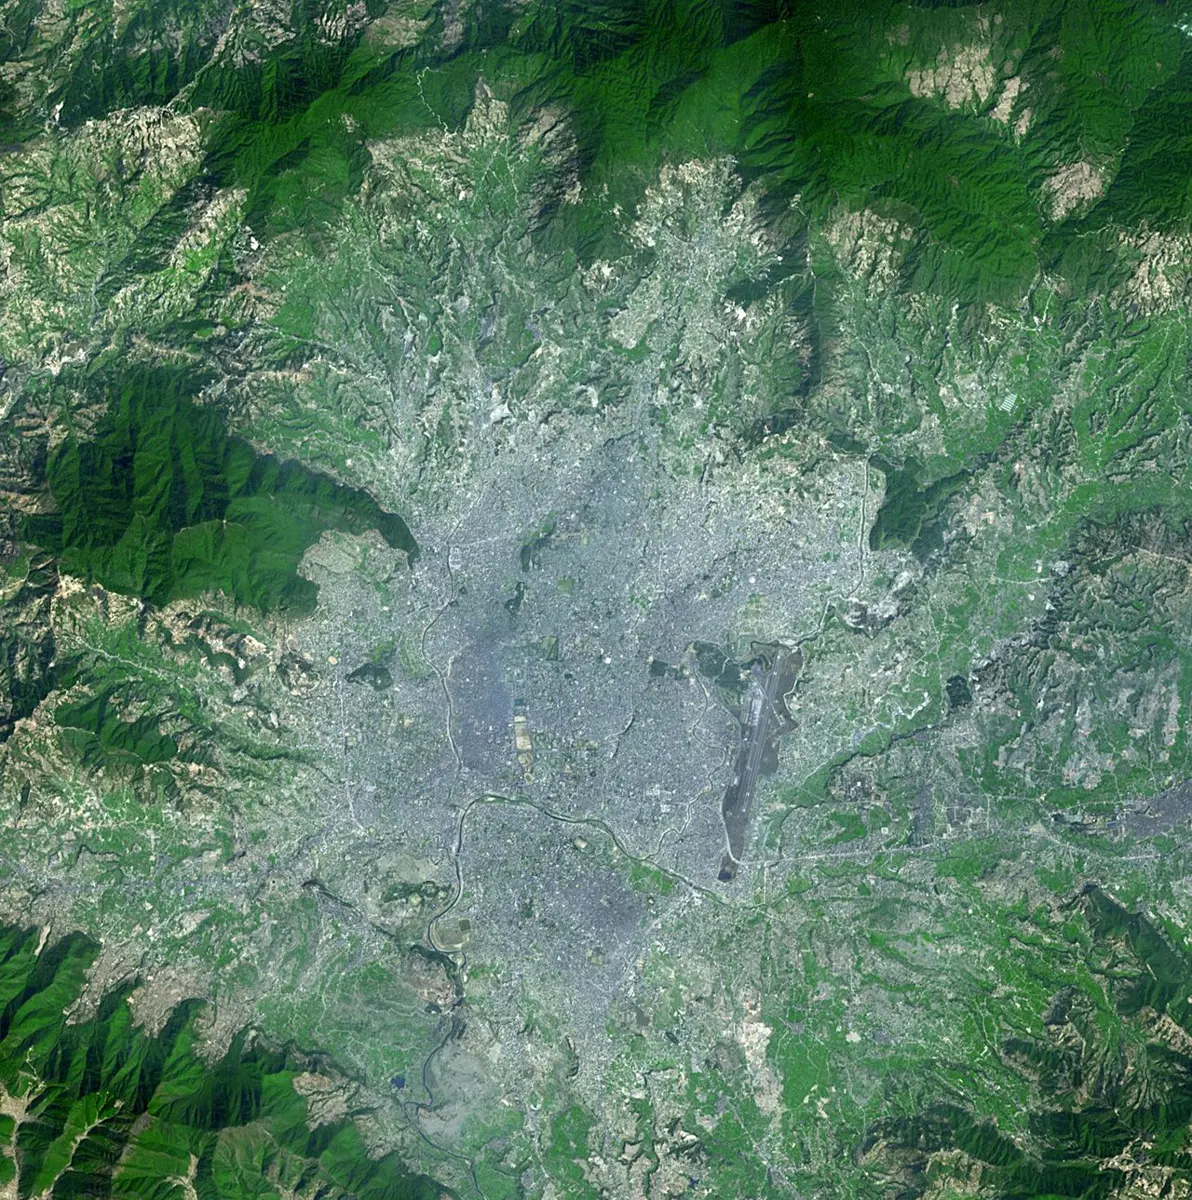
Between 1989 and 2015 the Kathmandu Valley’s farmland shrank by about 73 km², and its built-up land grew by about 100 km². What is the best explanation for the difference between the two numbers?
Pick an answer to see why.
Each of us using more
Now look at the other number: use per person. In Nepal it has changed even faster than the number of people.
- Getting about. In 2011 Nepal had about 1.1 million registered vehicles, about 43 for every 1,000 people. By early 2026 there were about 6.25 million, over 200 for every 1,000 people, four in five of them motorbikes and scooters. (These are vehicles ever registered, so some are no longer on the road.)
- Cooking. In 2011, 64 % of Nepal’s households cooked mainly on firewood and 21 % on LPG, gas from a cylinder. By 2021 it was 51 % on firewood and 44 % on LPG. Every cylinder is imported.
- Electricity, phones, cement houses, packaged food: each person in Nepal uses more of them each year.
Much of this is good news: less smoke in the kitchen, less time carrying wood, faster journeys, better houses. But each of these comes from somewhere, and most of the fuel ends up in the air as carbon dioxide (CO₂), the gas that is warming the Earth.
How can you tell which grew more, the people or the use per person? Use the same rule for growth. If the number of people is multiplied by one number and the use per person by another, the total is multiplied by the two together:
growth of the total = growth of the people × growth of the use per person
So if you know the growth of the total and of the people, you can work out the growth of the use per person: divide.
A town’s total electricity use grew 4 times in twenty years, while its population doubled. What happened to the electricity used per person?
Pick an answer to see why.
Not everyone uses the same
Use per person also differs hugely from country to country.
What the evidence shows
Now put the evidence together for the Kathmandu Valley. This is how scientists make an argument: a claim (what you think is true), the evidence (measurements that support it), and the reasoning (why the evidence supports the claim, using science you know).
Claim. The rise in the valley’s people, and in what each of them uses, has changed the valley’s land, water and air, and is changing them faster than nature puts them back.
Evidence.
- People: 1.11 million in 1991, 3.03 million in 2021 (censuses).
- Land: built-up land 39 km² in 1989, 140 km² in 2015; farmland down by 73 km² (satellite pictures).
- Water: a need of about 390 to 470 million liters a day, against about 290 million from the pipes (2023); already in the 1990s, studies estimated that wells took about 59 million liters a day from the deep aquifers, while only about 26 million a day could be taken without lowering them, and pumping has grown a great deal since; water levels measured in wells falling year after year, by about 80 cm a year on average by one estimate (2017).
- Air: six times as much CO₂ from Nepal’s fuel in 2023 as in 2000, mostly from each person using more.
Reasoning. Total use is the number of people times the use per person, and both have grown, so the total has grown faster than either. Land is fixed in a valley ringed by hills, so every square kilometer built on is taken from fields or forest. Water in an aquifer is like money in a bank: if more is taken out each year than goes in, the level must fall, and it has. And carbon dioxide stays in the air for centuries, so more burnt each year means more piled up.
When both grow at a few percent a year, the total grows at about the two percentages added together: 2 % more people and 1 % more water each makes about 3 % more water in all, each year. And 3 % a year doubles the total in about 23 years.
The total doesn’t always have to grow. Nepal’s hill forests are the best example: they were being cut for firewood faster than they grew in the 1970s, yet they have grown back since, while the population doubled, because villages took charge of them and families began cooking on gas. You can read how in What Is a Forest Worth?. The use per person of wood fell, and that was enough. (The gas, of course, now comes from somewhere else.)
Count your own water
Questions
A village of 500 families each burns 2 tonnes of firewood a year. Twenty years later there are 600 families, but half of them cook on gas and burn no wood, while the rest still burn 2 tonnes each. What happens to the wood burnt each year?
Pick an answer to see why.
Which of these is evidence for the claim “more water is taken from the ground under the Kathmandu Valley than rain puts back”?
Pick an answer to see why.
Explain, with an example, why the total use of a resource can grow even if the number of people stays the same.
Answer
The Kathmandu Valley had 1,647,092 people in 2001 and 3,025,386 in 2021. a. How many times did the population grow? b. At 130 liters a person each day, how much more water did the valley need each day in 2021 than in 2001? c. Melamchi’s first stage brings up to 170 million liters a day. Is that enough for the growth alone?
Answer
A country’s total use of electricity grew 9 times in thirty years, and its population grew 1.5 times. a. How many times did the electricity used per person grow? b. Which mattered more for the total, and why?
Answer
Using the evidence in this topic, write an argument (claim, evidence, reasoning) for this claim: “The growth of the Kathmandu Valley has changed its land.”
Answer
Nepal’s CO₂ per person grew about 5 times between 2000 and 2023, but in 2024 it was still only about 0.63 tonnes, against a world average of 4.7 tonnes. Someone says: “Nepal is too poor to matter; only the rich countries’ use counts.” Use the idea of total = people × use per person to say what is right and what is wrong in this.
Answer
In the 1990s, wells were estimated to take about 59 million liters a day from the valley’s deep aquifers, while only about 26 million liters a day could be taken without lowering them, about what rain puts back. a. By how much did the water stored in them fall each day? b. Suggest two ways of making the two numbers closer, one that changes the number taken out and one that changes the number put in.
Answer
Where to go next
- How Many People Can the Earth Support? For Grades 9–12: the world’s population and how fast it grows, ecological footprints, and a model of a village and its forest that you can build yourself.
- Why Is There Oil in Some Places but Not Others? Where the Earth keeps its oil, ores and groundwater, why the Kathmandu Valley’s deep aquifers refill so slowly, and why they took so long to form.
- How Do We Know How Dirty the Air Is? Measuring what people put into the air, and testing whether a fix works.
- Is the Earth Really Getting Warmer? What all that carbon dioxide is doing to the climate, and how we know.