
Your cousin holds out her phone. A reel is playing over dramatic music: a seashell, the Mona Lisa, a Greek temple, the pyramids of Egypt, a smiling face, each with yellow lines drawn on it and the same number flashing up: 1.618. “The number of beauty,” says the voice. “Nature uses it. The great artists used it. It is hidden everywhere.”
“Everywhere?” you ask. “Even in our flag?”
Nepal’s flag is a good test, because we know exactly how it was made: the Constitution of Nepal gives its shape as 24 steps with a ruler and compasses, from one line at the bottom. You can measure it on the page right now.
Guess first. Measure 12 different lengths on any object at all (a flag, a bus, a buffalo). Divide every length by every other. How likely is it that at least one pair gives a number between 1.58 and 1.66, close to 1.618?
Pick an answer to see why.
Hunt for 1.618
What the hunt found
Of the 66 pairs, two land between 1.58 and 1.66. The bottom edge divided by the upper left side is 1.597, only 1.3% below 1.618. The lower left side divided by the width of the sun is 1.652. A video could draw yellow lines on those two and announce that the flag of Nepal is built on the golden ratio.
It isn’t. The Constitution’s steps use the bottom edge, its third, quarter and half, and the diagonal of a square (which brings in ), nothing else. The upper left side works out to of the bottom edge, so 1.597 is an accident, and we can be sure of that only because the recipe is written down. For a shell, a face or a 2,500-year-old temple, there is no recipe to read, and the accidents look exactly like the real thing.
Why accidents are almost certain
Count the chances. With n lengths, each one can be paired with the n − 1 others, and each pair is counted twice that way, so there are pairs. Six lengths give 15 pairs; 12 give 66; 20 give 190.
Each pair has only a small chance of landing between 1.58 and 1.66, but the chances add up. We had a computer draw 20,000 sets of random lengths, each from a twentieth of the biggest up to the biggest, and as likely to fall between 1 and 2 cm as between 10 and 20 cm (as on a real object, which has more small details than big ones). With 6 lengths, about 1 set in 3 had a “golden” pair. With 12, about 4 in 5. With 20, 99 in 100. The exact numbers depend on how the lengths are spread (with lengths down to a hundredth of the biggest, 12 gave about 7 in 10), but the lesson doesn’t: more lengths, more accidents.
So the reel’s method (measure lots of things, keep the pairs near 1.618, show only those) is almost certain to “find” the golden ratio in anything. The mathematician George Markowsky, in a 1992 article that tested the famous claims one by one, called it the Pyramidology Fallacy, following the writer Martin Gardner, after the “pyramidologists” who juggled the Great Pyramid’s many lengths until they matched whatever they hoped to find.
How close is close?
Markowsky also asked how exact a measurement of a real object can be. If each of two lengths could be 1% too long or too short, their ratio can be off by about 2% either way: 0.99 ÷ 1.01 = 0.980 and 1.01 ÷ 0.99 = 1.020. So he counted a ratio within about 2% of 1.618 as “possibly golden” and, to be generous, widened that to 1.58 to 1.66, his acceptance range. Passing is only the first test. A ratio of 1.6 (which is 8 ÷ 5) or 1.65 passes too; something inside the range might have been built as 8 : 5, or as nothing in particular.
A building’s door is 2.1 m tall and 1.3 m wide. Its ratio, 1.615, is within 0.2% of 1.618. What does that show?
Pick an answer to see why.
What the golden ratio really is
The golden ratio is not a myth: it is a real and remarkable number. It comes from a question in Euclid’s Elements, written in Greek in Alexandria about 2,300 years ago.
The one cut that matches
Cut a stick into a longer and a shorter piece. Usually whole ÷ longer and longer ÷ shorter give different numbers. The Elements (Book VI, Definition 3) names the one cut where they are the same: a line is cut in extreme and mean ratio when “as the whole line is to the greater segment, so is the greater to the less” (our translation). Today this is called the golden section.
At one place, about 0.618 of the way along, the two numbers agree. The rectangle there is the golden rectangle: cut a square off it and the piece left over is a smaller golden rectangle, the same shape exactly, so you can go on cutting squares for ever. Every other rectangle changes shape as you cut.
The equation behind the cut
Call the whole line x and the longer piece 1, so the shorter piece is x − 1. The rule says
Multiply both sides by x − 1: , that is
This is a quadratic equation, the kind solved by the formula in Grade 10 (with a = 1, b = −1, c = −1):
A length can’t be negative, so This number is the golden ratio. Since about 1910 it has often been written , the Greek letter phi. Like , it is irrational: its decimals never end or repeat, because isn’t a fraction (the same proof works), so no real object can be exactly golden, only close.
The equation gives the number its strange habits. Its square is itself plus one: Divide the equation by and you get , so , the same decimals again. That is why the cut in the widget fell at 0.618: the longer piece is of the whole.
Which of these is true of ?
Pick an answer to see why.
Where 1.618 really lives
The golden ratio does turn up, exactly, in some places, and for reasons that can be proved.
In every regular pentagon
Draw a regular pentagon with sides 1, and draw two diagonals, AC and BD, crossing at P (Figure 23.1). Each corner of a regular pentagon is 108° (its five angles add up to ). Triangle ABC has two equal sides, so its other two angles are each ; the same is true of triangle BCD, so too.
Now look at the small triangle PBC. Its angles at B and C are both 36°, the same as triangle ABC’s, so the two triangles are similar (equal angles, so sides in proportion):
where d is the diagonal. And in triangle ABP, the angle at B is and the angle at A is 36°, so the angle at P is 72° too: two equal angles, so AP = AB = 1. That makes PC = d − 1. Put the two together: , which is , the golden equation. A regular pentagon’s diagonal is exactly times its side. Euclid proved it (Book XIII, Proposition 8: two diagonals “cut one another in extreme and mean ratio”), and used it to construct the pentagon with a ruler and compasses.
The five-pointed star inside a pentagon is full of it: every line in the star is cut in the golden ratio. Wherever a shape has true fivefold symmetry (Penrose’s tiles, the icosahedron and dodecahedron), the golden ratio is not hidden, it is built in.
In growing sequences
Start with any two numbers, add them to get the next, and keep going: 2, 5, 7, 12, 19, 31, 50, 81, 131… Divide each number by the one before and the answers settle on : 131 ÷ 81 = 1.617. With the Fibonacci numbers 1, 1, 2, 3, 5, 8, 13, 21, 34, 55, 89, the ratios go 1.5, 1.667, 1.6, 1.625, 1.615, 1.619, 1.6176, 1.6182, closing in from both sides.
Why? If the ratios settle on some number r, then a number divided by the one before, which is , settles on . So , the golden equation again. How Many Ways Can You Climb the Stairs? is where these sequences come from.
In sunflowers
A sunflower places each new seed about 137.5° round from the last, the golden angle (the share of a full turn), and its seeds form spirals in Fibonacci numbers. This one has been measured, modeled and explained: Why Do Sunflowers Count in Fibonacci Numbers? tells how. Unlike the reel’s claims, it comes with a reason (each seed squeezes into the biggest gap) and a prediction anyone can count.
Claims that don’t survive a ruler
Now test the reel’s examples the way Markowsky did: with real measurements, and with a question about where the lengths came from.
The shell
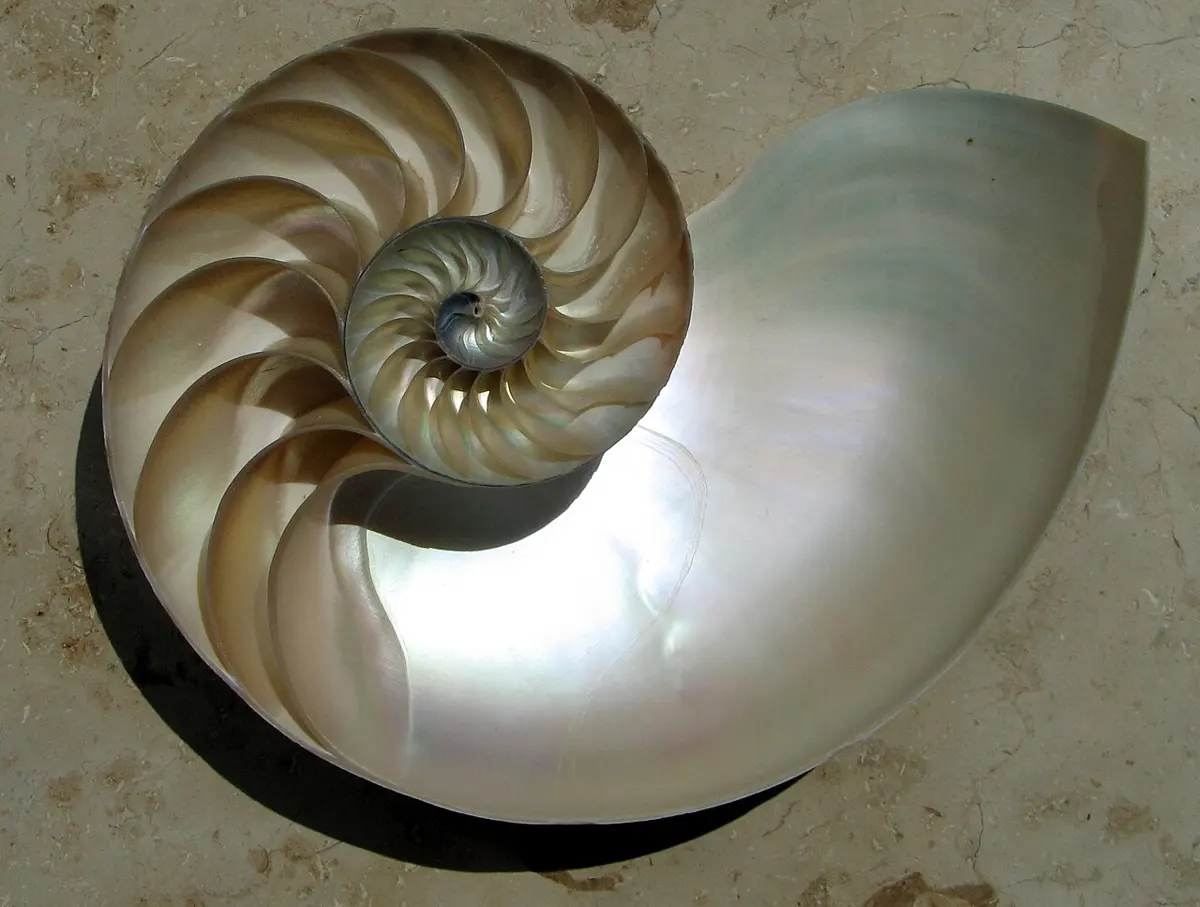
The nautilus is the most famous example, and half of the claim is true. Its shell is an equiangular (or logarithmic) spiral: it grows by the same factor every time it goes once round, so a young shell and an old one are the same shape. The other half isn’t. The golden spiral grows by every quarter turn, which is times every full turn. In 1999 the mathematician Clement Falbo measured nautilus shells in the collection of the California Academy of Sciences. Their spirals fitted rectangles whose sides were in ratios from 1.24 to 1.43, about 1.33 on average (roughly 4 : 3), not 1.618; the spiral roughly triples in width each turn.
Put the two side by side (Figure 23.3) and they don’t look alike at all: the golden spiral opens out so fast that it makes about two turns where the nautilus makes nearly four. Drawn over a photo with a thick line, along only part of one turn, the difference is easy to miss; follow a whole turn and it is plain.
The temple
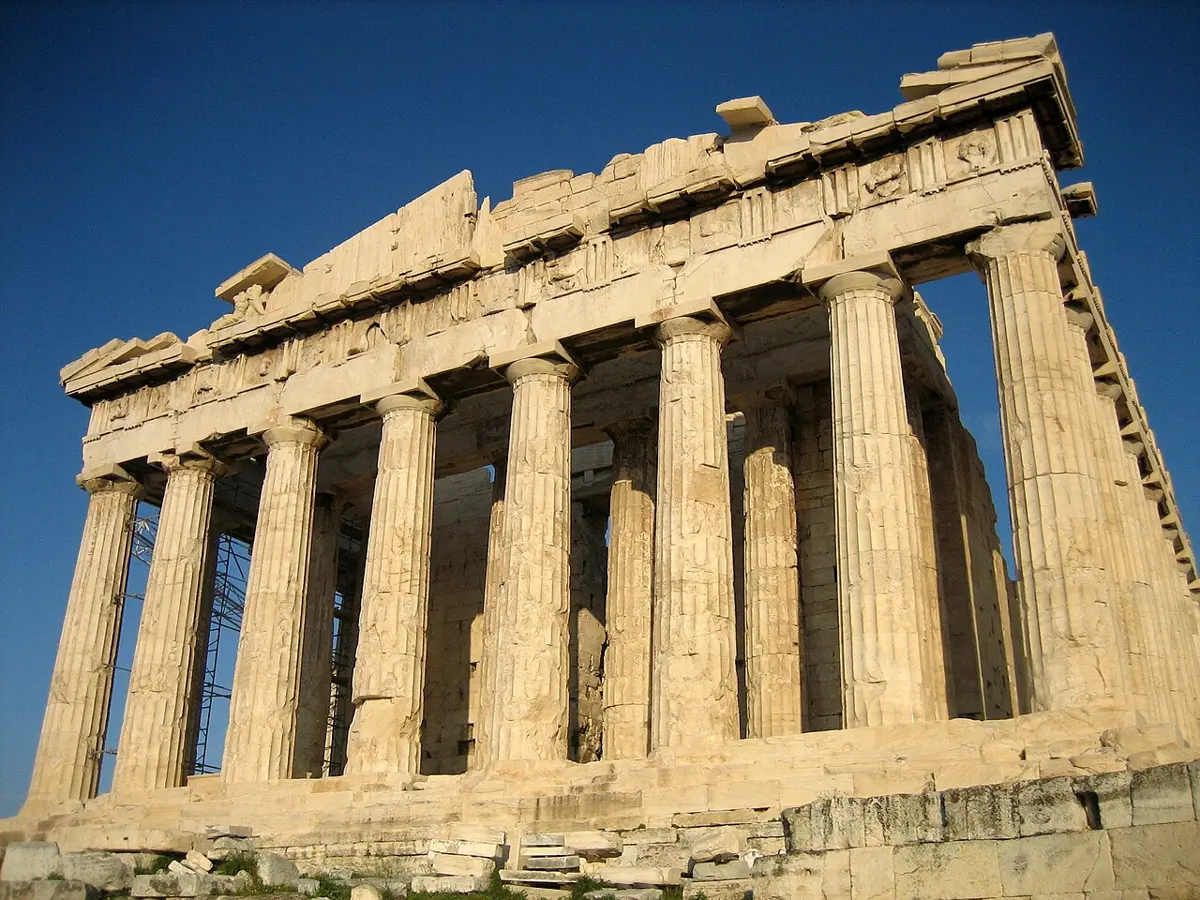
The Parthenon in Athens was finished around 432 BCE. Books and posters show its front inside a golden rectangle. Markowsky noticed that the drawings leave parts of the temple sticking out of the rectangle, and that the measurements disagree from one book to the next “probably because different authors are measuring between different points”: with so many numbers to choose from, an enthusiast can pick whichever fit.
With one published set of measurements (the architectural historians Trachtenberg and Hyman’s: height 45 feet 1 inch, width 101 feet 3.75 inches, length 228 feet), the width ÷ height is 2.25, and the length ÷ width is 2.25 again: the ratio 9 : 4, twice. The guidebook writer Stuart Rossiter, quoted by Markowsky, wrote that the Parthenon’s proportions are worked out in the ratio 4 : 9. Measuring to the top of the triangular gable instead gives 101 ÷ 59 = 1.71, outside the acceptance range too. A study of 99 Greek temples, tombs, coffins and gravestones found the golden ratio “totally absent” from the architecture of the Parthenon’s century. The Roman architect Vitruvius, in the first century BCE, discusses proportions only in whole numbers.
The body
The reel’s favorite claim is that your height divided by the height of your navel is 1.618. Markowsky measured his own family of four: 1.59, 1.63, 1.65 and 1.646. All four pass the acceptance range, and still they differ from each other by more than 3%. A navel is not a point, and as he dryly pointed out, it is a scar with no special importance in an adult. Leonardo’s famous drawing of the Vitruvian Man is often shown with golden lines, but its proportions don’t match the golden ratio, and the text Leonardo wrote beside it uses only whole-number ratios.
One person did build bodies on the golden ratio, on purpose. The architect Le Corbusier designed a scale of measurements he called the Modulor (published in 1948), based on a man 1.83 m tall whose navel he set at 1.13 m: 183 ÷ 113 = 1.619. That isn’t a discovery about people. It is a design rule, chosen by a person who liked the golden ratio and said so.
Is the golden rectangle the most beautiful?
The idea that people find the golden rectangle most pleasing goes back to experiments by the German psychologist Gustav Fechner, around 1876. Of his ten rectangles, the most popular had sides in the ratio 0.62, close to ; but many people chose others, Fechner is reported to have discarded results that didn’t fit, and later careful tests have been, at best, inconclusive. Markowsky’s audiences, shown 48 rectangles in a random order, liked 1.83 best, and most couldn’t see any difference between rectangles from 1.6 to 1.7. A study of 565 paintings by famous artists, made in 1999, found the average canvas was 1.34 times as long as it was wide, with each artist’s average between 1.04 and 1.46: they hadn’t chosen golden canvases.
The twist: a pyramid that fits two theories
The most striking near miss of all: the Great Pyramid of Giza, built around 2600 BCE, was designed (as Egyptologists read its measurements) to be 280 royal cubits high on a square base 440 cubits across.
Its slant height, from the middle of a side up the face to the top, is cubits. Divide by half the base, 220: 1.6186. That is within 0.03% of , far inside any acceptance range.
But try a different idea. The base’s perimeter divided by the height is , within 0.04% of . The same pyramid fits a “π theory” just as well as a “golden theory”. Both can’t be the design.
They fit together because two different numbers happen to be very close. The golden theory needs the faces to rise for every 1 across; the π theory needs . They differ by 0.1%, less than measurements of a pyramid that has lost its outer casing can tell apart. What points to an answer is a record of how Egyptians worked. Their mathematical papyri give a slope as a seked: how many palms the face runs inwards for every cubit (7 palms) it rises. The Great Pyramid’s faces have a seked of palms, a rise of : a simple number in their own units, lying between the two theories, so that both near misses come with it. Some Egyptologists still think the builders meant the link to the circle as well; but scholars agree the pyramid was not designed around the golden ratio, which would not fit what is known of Egyptian mathematics and architecture.
A story from maths
Where this is used
Questions
a. ★ Which of these rectangles is closest to golden?
Pick an answer to see why.
Use to show that , and check it with the decimals.
Answer
A regular pentagon has sides of 5 cm. How long is each diagonal, and into what two pieces does another diagonal cut it?
Hint
Answer
A friend measures 20 lengths on a photo of a temple and finds that one pair has a ratio of 1.62. Explain to them, with numbers, why this is no evidence that the builders used the golden ratio.
Answer
Show that and . What pattern do you see, and what does tell you about the golden spiral?
Hint
Answer
The Egyptians measured slopes by the seked: palms run inwards per cubit (7 palms) of rise, in palms and quarter-palm “digits”. Which seked would give a slope of exactly , the golden theory’s, and which exactly ? Could a builder have made either on purpose?
Answer
Where to go next
- Why Do Sunflowers Count in Fibonacci Numbers? (Grades 6–8) The golden ratio’s one famous home in nature that survives every test, and why.
- How Many Ways Can You Climb the Stairs? The Fibonacci numbers from counting, and where the ratio 1.618 comes from.
- Can You Prove √2 Is Not a Fraction? The proof that also shows , and so , is irrational.
- Can a Pattern of Tiles Never Repeat? Penrose’s two tiles, which come in the golden ratio.
- Why Are There Only Five Perfect Dice? The icosahedron, whose corners sit on three golden rectangles.
- Grade 10 Math: Quadratic equation Solving and its relatives by formula.
- Computing, Going Further: How Do You Find the Fake Coin in Three Weighings? (Grades 6–8) Another search that throws away part of the range with every measurement, like the golden-section search.
Where these facts come from
- The golden ratio’s definition and value; Euclid’s definition and propositions; Pacioli’s Divina proportione (1509), Livio on the 1799 error and Pacioli’s Vitruvian proportions; Kepler’s “precious jewel”; Gehler’s 1789 dictionary; Barr’s φ by 1910; Le Corbusier and the Modulor; Leonardo’s Vitruvian Man and its whole-number text; the 1999 study of 565 paintings (average 1.34, artists 1.04 to 1.46); Zeising (1854); the disputed claims (body proportions, the nautilus, Fechner’s experiments “at best, inconclusive”, the Great Pyramid and its scholarly consensus, the Parthenon, the study of 15 temples, 18 tombs, 8 sarcophagi and 58 stelae, Vitruvius’s whole numbers); Penrose tilings and quasicrystals: Wikipedia, “Golden ratio”, read October 2026.
- The Pyramidology Fallacy and Martin Gardner’s description of it; the ±1% → ±2% rule and the acceptance range 1.58 to 1.66; the Great Pyramid’s figures and the slant ratio 1.62; the Parthenon’s published dimensions (Trachtenberg and Hyman’s, ratios 2.25; Rossiter’s apex height, 1.71), Rossiter’s 4 : 9 and the measurements varying “probably because different authors are measuring between different points”; Fechner’s ten rectangles; Markowsky’s 48-rectangle tests (favorite 1.83; no differences seen between 1.6 and 1.7); his family’s navel ratios 1.59, 1.63, 1.65, 1.646 and the navel as a scar: George Markowsky, “Misconceptions about the Golden Ratio”, The College Mathematics Journal 23(1), 1992, pp. 2–19 (the author’s copy), read October 2026; quoted in our own words except where marked.
- Falbo’s 1999 measurements at the California Academy of Sciences (ratios 1.24 to 1.43, about 1.33), the nautilus tripling each turn and the golden spiral’s 6.85: Ivars Peterson, “Sea Shell Spirals”, Science News, 1 April 2005, reporting Falbo’s College Mathematics Journal article of March 2005, read October 2026. The nautilus as an equiangular spiral that is not golden: Wikipedia, “Nautilus” and “Chambered nautilus”, read October 2026.
- Euclid’s Definition VI.3 and Proposition XIII.8, and where the cut is used (II.11, IV.10–12): David E. Joyce, Euclid’s Elements, Clark University, read October 2026; quoted in our own translation.
- The Great Pyramid’s design of 280 by 440 royal cubits, the seked of 5½ palms (14 : 11), 51°50′40′′, the perimeter ÷ height and 2π, which some Egyptologists think was meant; built around 2600 BCE: Wikipedia, “Great Pyramid of Giza”, read October 2026. The seked, 7 palms to the cubit and 4 digits to the palm, the Rhind and Moscow papyri: Wikipedia, “Seked”, read October 2026.
- Fechner’s ten rectangles, the favorite 0.62, and his discarding of results: Wikipedia, “Gustav Fechner”, read October 2026.
- Zeising’s “universal law” and his studies: Wikipedia, “Adolf Zeising”, read October 2026. Barr’s φ after Phidias and his doubt that Phidias used it: Wikipedia, “Mark Barr”, read October 2026.
- The Modulor (1948), its man of 1.83 m and navel at 1.13 m: Wikipedia, “Modulor”, read October 2026.
- The bank card’s size, ID-1, 85.60 × 53.98 mm: Wikipedia, “ISO/IEC 7810”, read October 2026.
- The golden-section search, its φ : 1 : φ spacing, and Kiefer (1953): Wikipedia, “Golden-section search”, read October 2026.
- Nepal’s flag: Schedule 1 of the Constitution of Nepal (2015), as coded in this site’s
nepal-flag.tsfor Draw Nepal’s Flag. - Every number on this page (the flag’s 12 lengths, its 66 ratios and the two in the acceptance range, the chance of a “golden” pair among 6, 12 and 20 random lengths, the pair counts, and its powers, the Fibonacci ratios, the pentagon, the pyramid’s ratios and sekeds, the Parthenon’s ratios, the rectangles, the shells’ growth factors, the golden-section search and the answers to the questions) was computed by a script,
checks/textbooks/math-further-9-12/23/tmp/answers.py(withflag.tsfor the flag’s points).