
For fifteen days in November 2021, from the 11th to the 25th, more than 35,000 people went from door to door across the whole of Nepal with a questionnaire. At every household they asked the same questions: who lives here, how old are they, what do they do, what do they cook on, where do they get their water. The filled-in forms were carried to Kathmandu district by district, and those from Dolpa, Humla and Mugu came by helicopter. Months of sorting, checking and typing later, the answer came out as two numbers. Nepal had 29,164,578 people, living in 6,666,937 households.
Every number in this book came from something like that: someone asked, or counted, or wrote down a sale, and someone else added it all up. How economists then test their ideas against those numbers is How Economists Know’s story. This one is about the numbers themselves: how they are got, and how to read what comes out.
The plain answer is short. Statistics can tell you what is typical in a large group, how much the group varies, how one group compares with another, and how things change over time. That is a great deal. It lets a government plan schools where the children are, and lets a bank guess how many loans will go bad. Running a state is also where the word comes from. Statistik was a German word for the description of a state, the facts a ruler needed about his land and people, and it reached English late in the 1700s. The Nepali word is तथ्याङ्क, facts in numbers.
What statistics can’t do is just as short. It can’t tell you about any one person: knowing that the average household has a little more than four people says nothing about yours. It can’t count what won’t be counted, like kindness or how much a family trusts its neighbors, except roughly, through questions that stand in for it. It can’t be better than the asking: a careless question or a missed village goes into the total as if it were a fact. And it can be bent, by someone who picks the number that suits them. The rest of the chapter is these few things, slowly.
Where numbers come from
Before anyone knocks on a door, a few things have to be settled. What is the count for? What is being counted: a person, a household, a farm, a shop? Where, and for what stretch of time? And how will the answers be got? Get one of these wrong and no amount of adding up later will mend it. A census that left the purpose vague might ask about income in some places and wages in others, and the two can’t be added.
The person who asks the questions is the enumerator, गणक, and the person who answers is the informant, सूचनादाता. Data gathered this way, by the people who will use it, is first-hand data, also called primary data. Data that someone else gathered, which you take from their report or their records, is second-hand or secondary data. Most of the numbers in this book are second-hand: Nepal Rastra Bank’s figures, the World Bank’s, the statistics office’s. Second-hand data can be published, printed in a report anyone can read, or unpublished, sitting in an office’s files, like a school’s register of who passed. It saves enormous work, but it carries every choice its makers made, so it’s worth knowing what they were.
First-hand data can be got in several ways. The commonest is the questionnaire, a fixed list of questions asked the same way of everyone. Its questions can be closed, with the answers to choose from (“What does your household mostly cook on: wood, gas, cow dung, biogas, electricity?”), or open, where people answer in their own words (“Why did you move here?”). Closed answers are easy to add up; open ones say more but have to be sorted by hand. An interviewer can read the questionnaire aloud and fill it in, which helps where many people can’t read, or it can be left for people to fill in themselves. Some things are better watched than asked: a researcher counting how many buses pass a stop in an hour doesn’t need to ask anyone. And sometimes a small group is brought together to talk a question through, a group discussion, which finds out why people do things better than any form can.
The census is first-hand data on the largest scale. Nepal has held one about every ten years since 1911, and 2021’s was the twelfth. It was meant for May and June of that year and was put off because of COVID-19. Before it began, supervisors listed every building and household in the country, and the land was divided into small enumeration areas, each with its own map; about 70,000 maps were printed. In the hills an area held about 170 to 200 households, in the Tarai more, in the mountains fewer. The 8,545 supervisors and 35,657 enumerators were picked from about two hundred thousand applicants, and half of them were women. The questionnaire had more than fifty questions, mostly on paper, though a few parts of Kathmandu tried tablets. A person was counted at the home where they usually lived, and anyone who had been away more than six months was counted as absent, which is how the census knows how many Nepalis were abroad.
A census counts everyone, and that is its strength and its cost. Asking every household about everything it earns and spends would take years and more money than any government has. So most questions are put to a sample, a smaller group chosen so that it stands for the whole. The trick is in the choosing. A sample that picks itself, like the people who bother to answer a phone-in poll, can be wildly wrong, and Thinking Clearly, for the Curious tells how one famous poll went wrong in exactly that way, in Who Was Asked?.
Nepal’s biggest survey of how households live, the Nepal Living Standards Survey, shows how it’s done properly. Its fourth round, in 2022/23, asked 9,600 households, about one in seven hundred. They weren’t picked from a list of volunteers. The sample was stratified: the country was first split into fifteen parts, town and country in each of the seven provinces plus the towns of the Kathmandu Valley, so that every part would be represented. In each part, enumeration areas from the census were drawn at random, 800 in all, with bigger areas more likely to be picked. In each of those, every household was listed again, and twelve were picked at random. So the census, besides its own count, gave the survey its map. The interviews ran for a whole year, July to June, because a household in the month after the harvest doesn’t eat or spend the way it does in the month before. People were asked what they had eaten in the last seven days, and about other spending over the last thirty days or the last twelve months, since few people can remember a week’s salt from last winter.
Tables and charts
Thirty million answers are no use to anyone as a pile of forms. The first step in making sense of them is to sort them: by place (each province, each district), by time (each year, each census), or by size (households of one person, of two, of three). Then the sorted numbers go into a table. Here is one from the census, a little shortened.
| People in the household | Nepal | Urban municipalities | Rural municipalities |
|---|---|---|---|
| 1 | 357,315 | 237,911 | 119,404 |
| 2 | 886,221 | 599,935 | 286,286 |
| 3 | 1,235,800 | 880,380 | 355,420 |
| 4 | 1,521,930 | 1,063,048 | 458,882 |
| 5 | 1,107,218 | 725,969 | 381,249 |
| 6 | 695,484 | 440,568 | 254,916 |
| 7 | 371,929 | 228,115 | 143,814 |
| 8 | 220,066 | 133,254 | 86,812 |
| 9 or more | 270,974 | 170,482 | 100,492 |
| All households | 6,666,937 | 4,479,662 | 2,187,275 |
A table repays being read slowly, in a fixed order. First what it counts: households, not people, so the 357,315 in the first row are people living alone and the 270,974 at the bottom are big households of nine, ten or more. Then where and when: Nepal, on the census day in November 2021. Then the headings across the top, which here split the country into two kinds of local level, urban and rural municipalities. And then the bottom row, which is worth checking: the nine rows of the first column add up to exactly 6,666,937. A table sorted one way, by household size alone, is a one-way table. Split it again, by kind of place, and it becomes two-way, like this one. Split it a third time, by province or by whether the household head is a man or a woman, and it’s three-way, which is about as many as a reader can hold.
Once the table is read, a few things jump out. The commonest household has four people. It is the biggest row in town and in the country alike. Rural households run a little larger: 27% of them have six or more people, against 22% in the towns. And the column for urban municipalities is twice the size of the rural one. That doesn’t mean two Nepalis in three live in what anyone would call a city. The heading is the kind of local level a household falls in, as the country’s federal structure drew them, not how busy its street is. A table tells you what was counted, and only its headings tell you how.
A chart shows the same numbers so the eye can take them in at once. The bar chart above does what the table does, more quickly: the rise to four and the long slope down. Bars are best for comparing amounts side by side. Two bars for each size, one for town and one for country, would make a multiple bar chart; a single bar cut into pieces, to show what a whole is made of, is a sub-divided bar. When the bars stand for ranges that run on without gaps, incomes from Rs. 0 to 10,000, then 10,000 to 20,000, they are drawn touching each other, and the chart is a histogram. For a change over time, a line is clearer, because the eye follows the slope. For the parts of one whole, a pie shows each share as a slice: in 2021 just over half of households cooked mostly on wood, 51%, and 44% on gas, so the wood slice would be a little more than half the circle and the gas slice a little less, with a thin sliver for everything else.
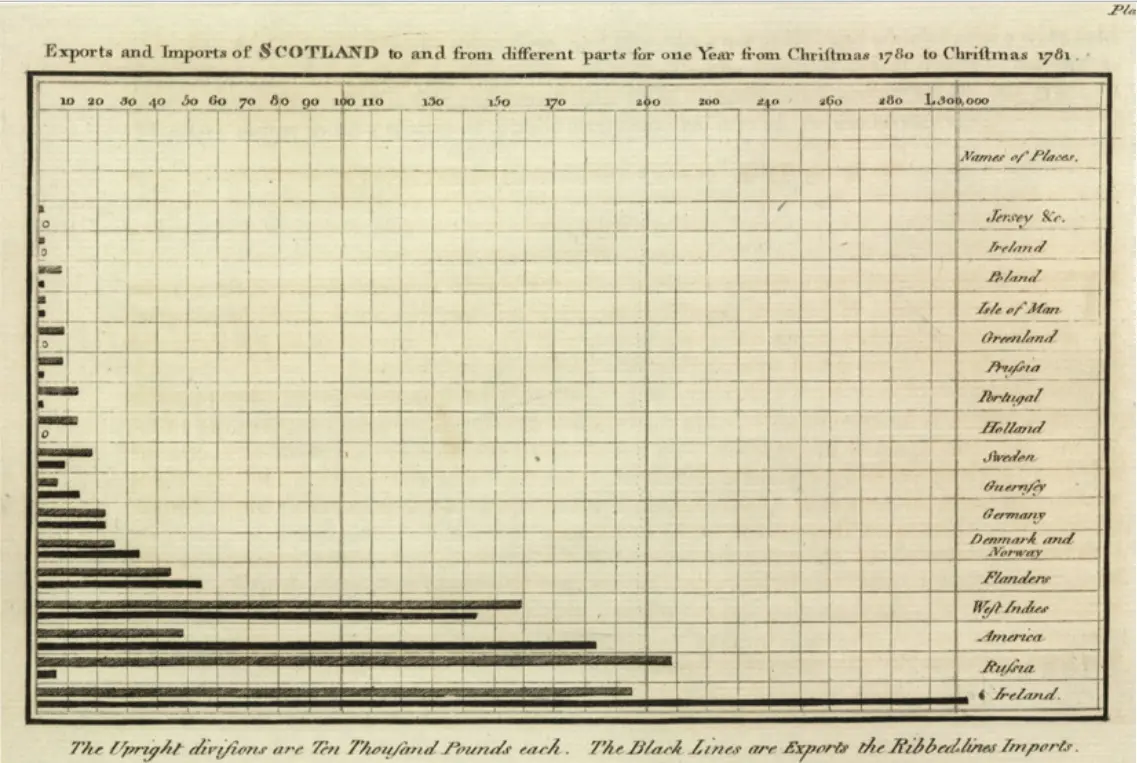
None of these is very old. The line chart of trade over the years, the bar chart and the pie chart were all first drawn, as far as anyone knows, by one Scotsman, William Playfair, who had worked as an assistant to James Watt, the steam engine’s improver. In 1786 he published a book of England’s trade with other countries, drawn as lines over the years. For Scotland he had only one year’s figures, so he couldn’t draw a line, and instead drew a bar for each place it traded with. The bar chart was born because a number was missing. Charts can mislead as easily as they inform, by cutting off the bottom of an axis or stretching one side, and Thinking Clearly shows how, in What Averages and Charts Hide.
The middle
A table of nine rows is easier than six million forms, but it is still a lot to say. Often what someone wants is one number: how big is a household, typically? There are three ways to answer, and they don’t always agree.
The mean is the one most people call the average. Add up everything and divide by how many there are. The census counted 29,164,578 people in 6,666,937 households, so the mean household had 4.37 people. The table alone can’t give this exactly, because the last row lumps nine and ten and fourteen together, but the census counted the people too. The median is the middle one: line every household up from smallest to biggest, and see the size of the one halfway along. Adding up the rows, the first three come to 2,479,336 households, short of half, and with the fourth the total passes half, so the median household has four people. The mode is simply the commonest, the biggest row, and that is four as well.
Here they nearly agree, because household sizes bunch around the middle and few households are very large. Income is different. In 2022/23 the living standards survey found that Nepal’s households had a mean income of Rs. 551,148 a year. The median was Rs. 383,389. The mean is 44% higher than the middle household’s income. A household earning the “average” is not in the middle at all; more than half of all households earn less.
The reason is the shape. Incomes can’t fall below zero, but at the top they can run very high, and a few large incomes pull the mean up without moving the median. A village of ninety-nine farmers and one rich trader has a high mean and a farmer’s median. So when someone says the average household earns over five lakh rupees a year, they are telling the truth, and it is still a picture of almost nobody. For incomes, house prices and wealth, the median is usually the fairer middle. For things that add up, like how much tax a town will raise, the mean is the one that matters, because the trader pays his share. The mode is the only one of the three that works for things that aren’t numbers at all: the commonest cooking fuel is wood, and there is no mean of wood and gas. How far apart Nepal’s richest and poorest really are is its own story, told in Inequality, and why the mean misleads when a few are far from the rest is drawn out with handles to drag in What Does an Average Hide?.
How spread out
Even the median leaves something out, which is how far the others are from it. Here are two made-up towns of five households each, with their monthly incomes. In Town A they earn Rs. 34,000, 37,000, 40,000, 43,000 and 46,000. In Town B they earn Rs. 10,000, 20,000, 40,000, 60,000 and 70,000. Both towns have a mean of Rs. 40,000 and a median of Rs. 40,000. On paper they are the same town. To live in, they couldn’t be more different. In Town A every family is within a few thousand rupees of its neighbors. In Town B one family lives on a quarter of the average, while another earns seven times what the first does.
The simplest measure of the difference is the range, the highest minus the lowest: Rs. 12,000 in Town A, Rs. 60,000 in Town B. But the range looks only at the two ends, and one unusual household changes it completely. A better measure uses everyone. Take each household’s distance from the mean. In Town A they are 6,000 and 3,000 below, nothing, then 3,000 and 6,000 above. Adding them up gives zero, as it always does, because the ones below cancel the ones above. So square each distance first, which makes them all positive and counts big gaps more than small ones, then take the mean of the squares. That is the variance. Town A’s comes to 18 million and Town B’s to 520 million.
Those are in squared rupees, which mean nothing in a shop. Taking the square root brings them back to rupees, and the result is the standard deviation, about how far a typical household is from the mean: Rs. 4,243 in Town A and Rs. 22,804 in Town B. And one more step makes spreads comparable even when the averages differ. Divide the standard deviation by the mean, as a percentage, and you have the coefficient of variation. Town A’s is 11%; Town B’s is 57%. The bigger the percentage, the less the mean tells you about any one household.
The coefficient of variation is what makes very different things comparable. Rice yields in two districts, heights of children in two schools, prices in two years: each has its own mean and its own units, but a spread of 11% means the same thing whatever was measured. It’s also why economists rarely trust an average alone. A country’s mean income can rise while most of its people are no better off, if the rise all went to a few, and only a measure of spread, or the median beside the mean, shows it.
None of this needs a computer, only patience, which is what the enumerators had. Statistics begins with someone at a door asking a question carefully, and it ends with a few numbers that are only as honest as that asking. In between, the sums are simple: sort the answers, read the table from its title to its total, find the middle three ways, and ask how far the rest are from it. Anyone who can do that can check most of the numbers they are shown, including the ones in this book. One chapter is left, and it takes the whole book back to where it began, a cup of tea in Anshu’s shop.
Found a mistake? Please tell us.