
Imagine lining up everyone in Nepal by how much they spend in a year, the poorest at one end and the richest at the other, and then cutting the line into ten equal groups. The survey teams of 2022/23 did, in effect, just that. In the poorest group a person’s food, clothes, rent, fares and fees came to about Rs. 48,633 for the whole year. In the richest group they came to about Rs. 316,462, six and a half times as much. Put all of Nepal’s spending in one heap, and the poorest tenth of the people account for 3.7% of it, the richest tenth for 24%.
A poverty line asks who falls below it. Inequality asks a different question: how far apart are the people along the whole line, from the bottom to the top? A country could have nobody below the poverty line and still be very unequal, and a country where nearly everyone is poor can be fairly equal. Inequality, आर्थिक असमानता, is about the gaps, not the floor.
Income and wealth
Two things get shared out unequally, and they are easy to mix up. Income is what comes in over a period: a month’s wages, a year’s harvest, the rent a landlord collects, the interest on savings. Wealth is what a person owns at a moment: land, a house, gold, a shop, shares, money in the bank. Income is a flow, like water running into a tank; wealth is the water already in it.
A young teacher in Pokhara may have a steady income and no wealth at all, renting a room and saving little. An old farmer in Jumla may own four ropani of land and a house and see very little cash in a year. Wealth also makes income: land gives a harvest or a rent, savings give interest, a building gives a rent every month. So the two feed each other, and wealth piles up across a lifetime and is passed down to children in a way that wages are not.
That is why, everywhere it has been measured, wealth is far more unequal than income. The World Inequality Lab, a research group that estimates these shares for most countries, put the world’s picture for 2025 like this. The poorest half of the world’s adults earned about 8% of all income, and the richest tenth 53%. But the poorest half owned only about 2% of all wealth, and the richest tenth about 75%.
Nepal’s official measure of inequality is built on neither. It uses what people spend, or consume, which is easier to ask about honestly in a country where many families eat rice from their own fields, earn in good months and bad, and couldn’t say what their land is worth. Spending is also steadier than income: a family with a poor harvest borrows or eats into its savings and keeps eating. So inequality of spending usually looks smaller than inequality of income in the same country, and the two can’t be compared as if they were the same thing.
The curve and the number
There is a neat way to draw the whole line at once. Go along the people from the poorest, and at each step ask what share of the total the people so far have between them. Plot the share of people across and the share of the total up. If everyone had exactly the same, the poorest 10% would have 10%, the poorest half would have half, and the points would make a straight diagonal line. In any real country the poorest 10% have less than 10%, so the points fall below the diagonal and make a curve that sags under it, rising steeply only at the end, where the richest are. This is the Lorenz curve, after Max Lorenz, who first drew it.
The more unequal the country, the further the curve sags. The statistician Corrado Gini gave a way to turn that sag into one number. Take the area between the diagonal and the curve, and divide it by the whole triangle under the diagonal. If everyone had the same, there is no gap, and the Gini coefficient is 0. If one person had everything and the rest nothing, the curve would run flat along the bottom and leap up at the very end, the gap would fill the whole triangle, and the Gini would be 1. Real countries sit in between.
The village shows something easy to miss. As the richest household’s income rises from Rs. 6 lakh to Rs. 20 lakh a year, nobody else in the village loses a rupee. Yet the curve sags further and the Gini climbs from 0.28 to 0.52, because every other household now has a smaller share of a bigger whole. Inequality measures how a total is divided, not whether anyone got poorer. Whether that matters is a question of values, and people answer it differently: some see only the richer household’s good fortune, others a village in which one family can now outbid all the rest for land or for the headman’s ear.
Nepal’s Gini for spending in 2022/23 was 0.30. In the cities it was 0.30 and in the villages a little lower, 0.29. It has moved around a lot. The survey of 1995/96 gave 0.32. By 2003/04 it had jumped to 0.41. By 2010/11 it was back to 0.33, and by 2022/23 it had eased to 0.30.
Among countries that measure spending, as Nepal does, that puts it in the middle of South Asia: India’s Gini was 0.26 in 2022, Bangladesh’s 0.31 the same year, Pakistan’s 0.34 in 2024 and Sri Lanka’s 0.38 in 2019. Countries that measure income instead give larger numbers for the same reason as before: the United States 0.42, Brazil 0.50, Sweden 0.29, all for 2023 or 2024. That Sweden, one of the most equal rich countries, sits near Nepal doesn’t mean the two are equally fair; their numbers measure different things.
One number also hides a lot. Two very different curves can enclose the same area, one with the poorest far behind and the middle close together, the other with a few at the top far ahead. And a Gini says nothing about why the gaps are there. For that one has to look at who is where.
Land and what is handed down
For a farming country, much of its wealth is land, and the usual way to get land is to be born to it. A family with a few ropani more has food in a bad year and something to borrow against.
The country’s farm census of 2021/22 counted 4.13 million holdings, each a household or other unit that farms, working 2.22 million hectares between them, an average of a little over half a hectare each. That average hides a long tail. More than four in five holdings work less than a hectare, and together they farm a little over half the land, about 57%; another 3% work no land at all. At the other end, only 3% of holdings work 2 hectares or more, and they farm about 17% of it. The census counts the land a household works, its own and what it rents, not what it owns, so it can’t show how unequal ownership is: a landowner who rents everything out doesn’t appear as a farmer at all, and a tenant appears as one.
Owning land isn’t the same as being rich, though. In 2022/23 about 64% of households owned some farmland, but ownership was lowest in Madhesh and Bagmati, about half of households, and highest in Karnali, about 85%. Poorer and rural households were more likely to own land than richer and city ones. A family in Karnali may own its hillside fields and still be poor, because the fields are small, steep and dry, while a family in Kathmandu with no farmland can be well off. What land is worth depends on where it is.
Inheritance carries wealth down the generations, and for a long time it carried it mainly to sons. The farm census found that women were 32% of those who run the farm, but their farms held only 22% of the land, about 0.37 hectares on average against men’s 0.62. The national census of 2021 asked who owned the house or the land, and about 24% of households had the land, the house or both in a woman’s name; only 12% had both. The Constitution of 2015 says, in Article 18(5), that all children have an equal right to their ancestral property without discrimination by gender, and in Article 38(6) that husband and wife have equal rights to property and family affairs. A law is not the same as practice, and the census figures show how far women’s land still lags behind men’s.
Who is left behind
Inequality is not only between rich and poor households. It also runs along lines a person is born on: caste, sex, and where in the country they grow up. Talking about this needs care. An average for a group says nothing about the person in front of you; every group has its rich and its poor, and the gaps are about chances and history, never about ability.
The latest survey whose report gives poverty by caste and ethnic group is the one of 2010/11. In that year a quarter of all Nepalis were below the line. In that report’s table, as researchers have reprinted it, about four in ten Dalits of the hills and of the Terai were poor, against about one in ten Brahmins of the hills. Those gaps grew out of centuries of being kept from land, schooling and some kinds of work by the old caste rules. Article 40 of the Constitution now promises Dalits free schooling with scholarships, special provision for health and social security, and land, once, for those who have none. Whether the gaps have narrowed since 2010/11 can’t be read from the latest survey’s published reports, which don’t break poverty down that way.
Place matters too. In 2022/23 a person in the Kathmandu Valley’s towns spent on average about Rs. 263,000 a year, a person in Madhesh’s villages about Rs. 72,000: about 3.7 times as much. Part of that is only prices. Rent, food and fares cost far more in the Valley, which is why its poverty line is so much higher. Measured against what a basic life costs where each lives, the Valley’s average is about two poverty lines and rural Madhesh’s about one and a half: still a gap, but much smaller than the rupees suggest.
Then there is the gap between men and women. The Labour Force Survey of 2017/18 asked people who worked for an employer and were paid in cash what they earned in a month in their main job. Half the women earned Rs. 12,000 or less, half the men Rs. 18,000 or less, so the middle woman earned about two-thirds of what the middle man did. Women were 58% of those earning under Rs. 7,600, and only 12% of those earning Rs. 25,000 or more. Fewer than one manager in seven was a woman.
That is not quite the gap for the same work, and it’s worth being careful why. Some of it comes from women and men doing different jobs. The survey grouped jobs into only nine broad kinds, and within every one of them men’s middle pay was higher, but by very different amounts. Among technicians and in paid farm work women earned about 95% of what men did; among professionals, teachers, doctors and engineers, about half, which probably says more about which professional jobs each holds than about two teachers in the same school. The survey also didn’t ask about the same hours: on average employed women worked fewer hours than employed men, but those averages cover everyone working, not only the employees paid in cash. So the honest reading is that women in paid jobs earned about a third less than men, that part of that is different jobs and hours, and that the survey can’t say how much. The law is plain about the part that isn’t: Article 18(4) of the Constitution forbids discrimination by gender in pay for the same work, and section 7 of the Labour Act, 2074 (2017) forbids discrimination by sex in pay for work of equal value.
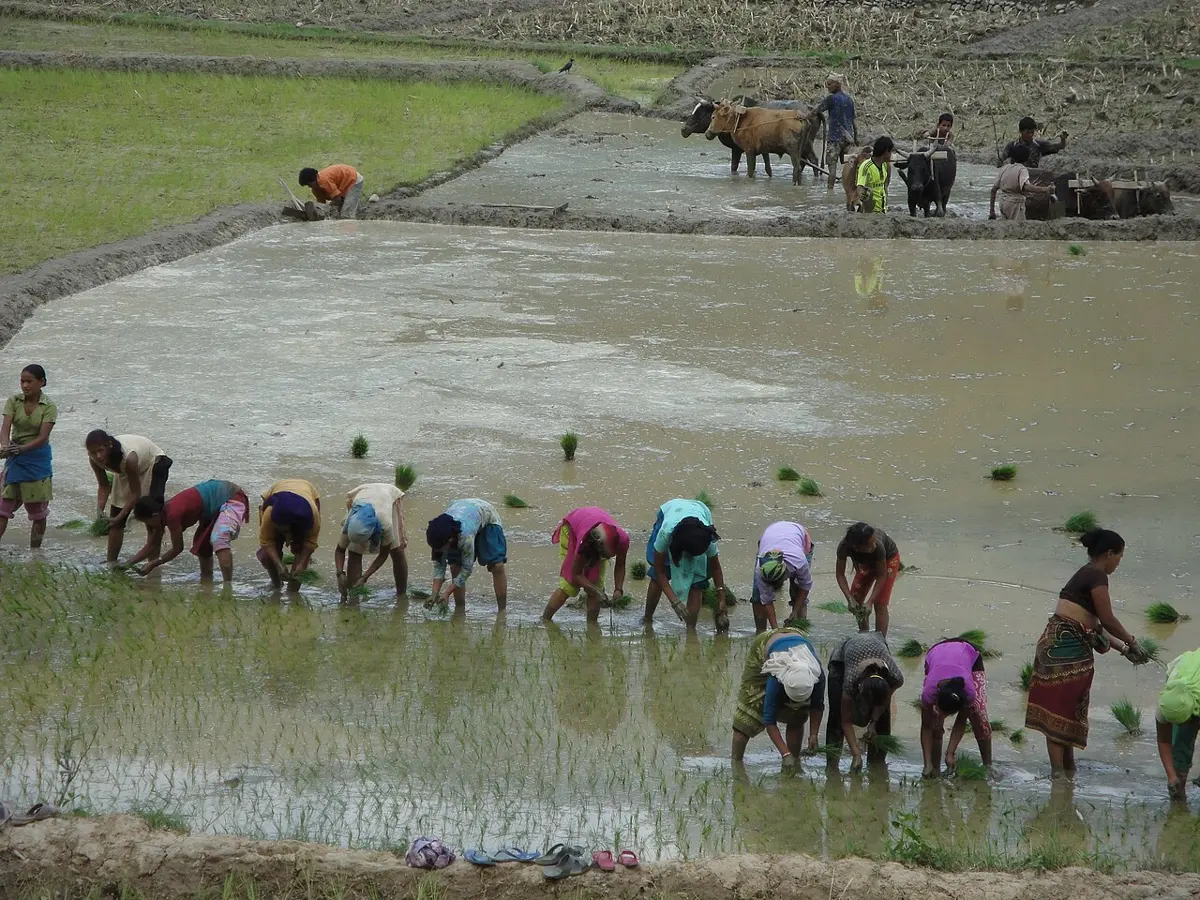
Most of women’s work never reaches a pay slip at all. The same survey asked who had, in the week before, done any of the work a household needs for itself: cooking, cleaning, shopping, caring for children, the old and the sick. Of those aged 15 and over, 91 women in a hundred had, and 47 men in a hundred. For housework alone the gap was wider, 89 women in a hundred and 39 men. None of this is counted as income, and none of it is in GDP. The World Inequality Lab, putting together time-use surveys from around the world for the years 2020 to 2025, found that women worked about 53 hours a week counting this unpaid work and men about 43, and that a woman’s income for each hour she worked was 61% of a man’s if only paid work was counted and only 32% once the unpaid hours were added in.
Bringing people in
Nepal’s school books use a word for the answer to much of this: आर्थिक समावेशिता, economic inclusion. It means that groups who have been left behind, women, Dalits, आदिवासी जनजाति (the country’s indigenous peoples), Madhesis, Tharus, people with disabilities and those in remote places, get fair and equal access to jobs, to banks and loans, to schooling and training, and to the chance of starting a business. The case made for it is that it is not only fair but useful: people brought in add to what the country produces, lift themselves out of poverty, start firms, widen the market for everyone else’s goods, keep their children healthier and in school, strengthen society, and sharpen competition.
The Constitution builds the idea into the state. Article 42(1) gives groups left behind (women, Dalits, indigenous peoples, Madhesis, Tharus, Muslims, people with disabilities and the people of backward regions among them) the right to take part in the state’s bodies on the principle of proportional inclusion, and Article 50(3) sets as an aim of the economy ending economic inequality by just distribution. The Local Level Election Act, 2073 (2017) requires each party to put women forward for half of its candidates for mayor and deputy mayor, chair and vice-chair (section 17(4)), and gives every ward committee two women members, one of them a Dalit woman (section 6(2)). In the local elections of 2017, the first held under it, women won about 41% of all local posts, but men held almost 98% of the mayors’ posts: most women were put forward for deputy.
Put together, the causes are much the same everywhere. Land, houses and savings are handed down, so families that started ahead stay ahead. Schooling is unequal, and so is the pay it leads to. Some people are kept out by caste, sex or language, and others by living days’ walk from a road, a bank or a good school. And those who own the land, the buildings and the firms collect rent, interest and profit on top of what they earn by work. None of this can be undone completely, but all of it can be narrowed, and there is a familiar toolkit for doing so. A tax that takes a larger share of larger incomes, as Nepal’s income tax does, narrows the gap after tax. Free schooling, clinics and scholarships narrow it for the next generation, which is where it matters most, since a child’s chances shouldn’t depend on her parents’ land. Cash allowances, such as those the Social Security Act, 2075 (2018) gives the old, single women, people with disabilities and the poorest, put money directly into hands that need it. Laws on equal pay and equal inheritance remove some of the rules that made the gaps, and quotas in jobs and politics make the people deciding look more like the people being decided for.
Economists used to argue that all this came at a price. The economist Arthur Okun called it in 1975 the “big trade-off”: taking from the rich to give to the poor, he said, was like carrying water in a leaky bucket, some of it lost on the way to work not done and investment not made. Later work has made the picture less gloomy. In 2014 Jonathan Ostry and two colleagues at the International Monetary Fund looked at a large set of countries over decades and found that countries with less inequality after taxes and transfers tended to grow faster and for longer without a slump, and that redistribution itself did not seem to harm growth except when it went very far. More unequal societies, they suggested, waste the talent of poor children who never get the schooling, and are more prone to political fights and crises. That is not the last word, and the evidence is of the kind that can show what goes together more easily than what causes what.
The economist Kate Raworth has put the question another way: an economy should keep everyone above a social floor, enough food, health, schooling, a voice, and below the limits of what the planet can bear, which she drew as a doughnut. Branko Milanović, who studies the world’s inequality, replied in 2018 that lifting everyone in the world to the middle income of today’s rich countries would need the world’s output to grow about three times. Her book, which calls itself agnostic about growth, doesn’t reckon with that, he said, and he called it “a book of miracles”, though he did find sense in her case for sharing out what people own more evenly, not only what they earn.
What can be said with some confidence is this. Nepal’s spending is shared out less unequally than in many countries, and less unequally than twenty years ago. But underneath that one number are gaps that people are born into: a farm handed to the son and not the daughter, a Dalit family that started a century behind, a woman who works more hours than her husband and is paid for fewer of them. Those are the gaps a single coefficient can’t show, and they are where most of the argument about fairness takes place.
Found a mistake? Please tell us.