
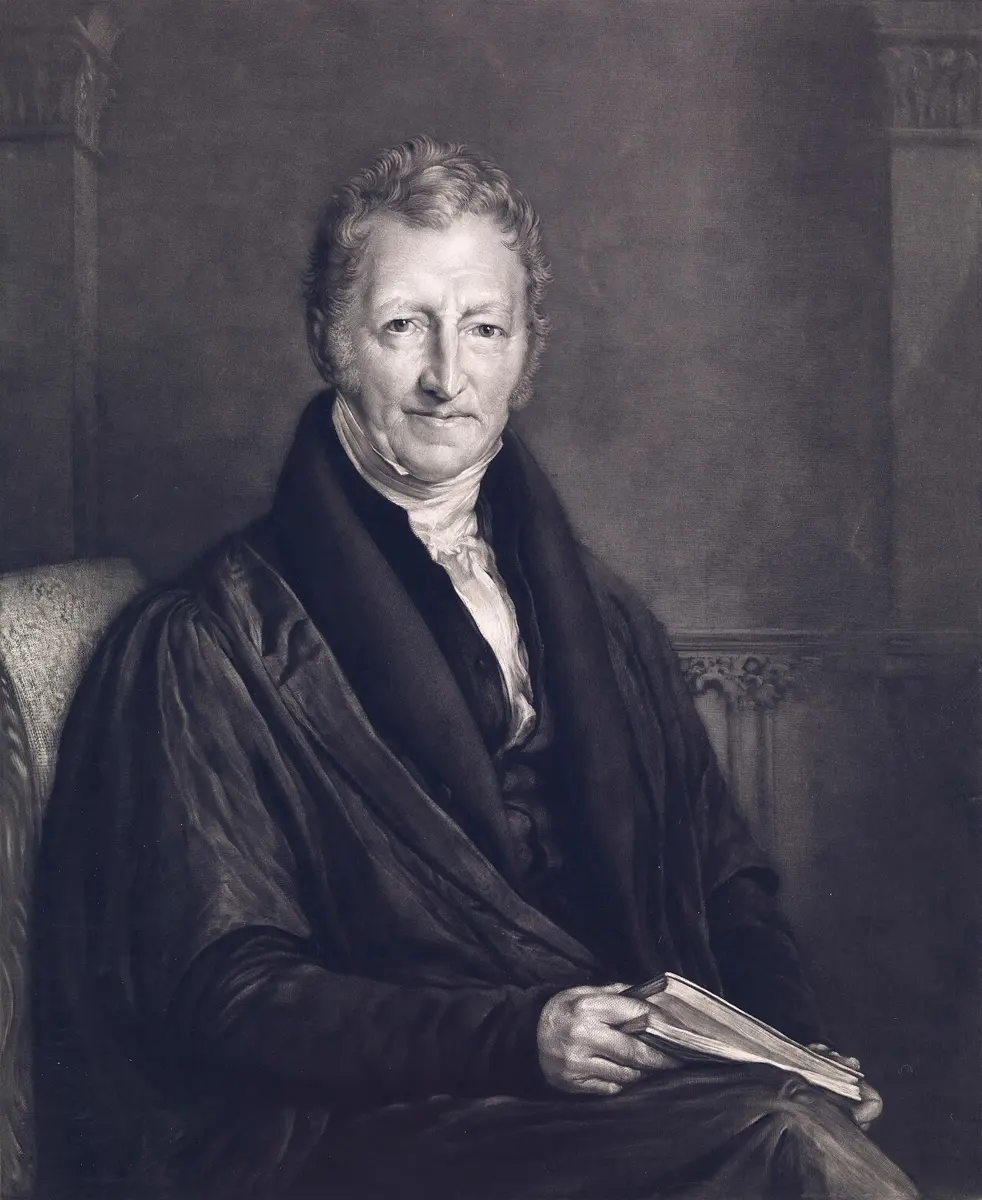
In 1798 a young English clergyman, Thomas Robert Malthus, published a short book without his name on it: An Essay on the Principle of Population. Its argument was simple and grim. People, he wrote, can double their numbers every 25 years, while the food a country grows can at best rise by the same fixed amount each time. So population must always run ahead of food, and be pulled back by hunger, disease and war. Two centuries later the world has eight times as many people as in his day, and on the whole they eat better than his readers did: he was wrong about food. But his question, what limits the growth of a population, is the starting point of demography, and it led Charles Darwin and Alfred Russel Wallace, who both read him, to natural selection.
This unit is about the human population: what a population is and how it is measured; how populations grow, and why they stop; how the world’s and Nepal’s populations grew; what crowding does; how families plan their size; and how countries pass, over a century or two, from many births and many deaths to few of each.
Demography is the study of human populations: their size, how they are made up (age, sex), where they live, and how they change by births, deaths and migration; a demographer is a scientist who studies them.
A population (Latin populus, people) is a group of individuals of the same species living in a given area at a given time and functioning as a unit. In ecology, its members can breed with one another, so they share and exchange genes. Biologically it is often described as a self-regulating system: as it grows, shortages of food and space slow its growth again. The human population, then, is the people living in a given place at a given time: a village, Nepal, the world.
A biological (biotic) community is different: it is all the populations of different species living together in one area and depending on one another for food and shelter. The deer, tigers, grasses and trees of Chitwan National Park together are a community; the tigers alone are a population.
The human population can be understood in three parts: describing it (8.1–8.4 below follow CDC’s 9.1.1), the problem of its growth and how to control it (9.1.2), and the demographic cycle (9.1.3).
9.1.1 Description of the human population
A human population is described by its characteristics, its dynamics, its census and its main features.
I. Population characteristics
A population has features that no single member has: a birth rate, an average age, a share of males. In everyday use “population characteristics” also cover gender, ethnicity, education, household income, poverty and life expectancy, all tied to the health of the community. For a biologist, the key ones are natality, mortality, distribution, density, sex ratio, age structure and dispersal.
i. Natality
Natality is the production of new individuals by birth. Its measure, the birth rate (natality rate), is the number of live births in a year per 1,000 people of the average population, the crude birth rate (CBR):
Natality depends on the size of the population and the time taken. Demographers keep the word fertility for how many children women actually have: the total fertility rate (TFR) is the average number of children a woman would have in her life at today’s rates. About 2.1 children per woman just replaces the parents (a little over 2, because some children die young and slightly more boys than girls are born).
In Nepal in 2025 the birth rate was about 19 per 1,000 a year and the TFR about 1.9, down from about 47 per 1,000 and 6 children per woman in 1950 (UN World Population Prospects 2024).
ii. Mortality
Mortality is the loss of individuals by death. Its measure, the death rate (mortality rate), is the number of deaths in a year per 1,000 of the average population, the crude death rate (CDR):
Nepal’s was about 7 per 1,000 in 2025, down from about 26 in 1950. Mortality varies between species and with age, and is tied to natality (a species that loses many young produces many). It depends on crowding, competition, predators, parasites, poisons made by other organisms (antibiosis), disease and the environment. Morbidity is different: it is how common a disease or ill health is in a population, not deaths from it.
iii. Population distribution
Population distribution (dispersion) is how the individuals of a population are spread over its area. There are three patterns:
- Random distribution: each individual is placed by chance, with no pattern and no effect of one on another; rare, found where the habitat is even and the individuals don’t attract or repel one another.
- Uniform distribution: individuals are spaced fairly evenly, usually because they compete or defend territories (seabirds nesting just out of pecking reach of one another), or are planted so.
- Clumped distribution: individuals are gathered in groups, round water, food or shelter, or because they live socially (a herd, a fish shoal, people in towns and villages): the commonest pattern in nature.
iv. Population density
Population density is the number of individuals per unit of area (or of volume, for water or soil) at a given time:
where D is the density, N the number of individuals and S the area (or space) they occupy. For people it is given as persons per square kilometer (per km²). Nepal had 29,164,578 people on its 147,516 km² in the 2021 census, a density of about 198 per km², though very unevenly: Kathmandu District has nearly 5,000 per km², Manang about 3 and Dolpa about 5.
v. Sex ratio
The balance of males and females, the sex distribution, affects natality, since births depend on the number of women. It is given as the sex ratio. Nepal’s census counts it as males per 100 females: in 2021 there were 14,253,551 males and 14,911,027 females, a ratio of about 96 males per 100 females, fewer males partly because so many young men were working abroad. India’s census counts it the other way, as females per 1,000 males. At birth, about 105 boys are born for every 100 girls, everywhere.
vi. Age structure
The age distribution affects both natality and mortality. Ecologists sort a population into three age groups:
- pre-reproductive: the young, not yet able to reproduce (in people, children under about 15);
- reproductive: adults able to have children (in demography, women of 15–49);
- post-reproductive: those past having children (in women, after about 45–50, the menopause).
A population with many young people will grow even if each family is small, because so many are about to reach the reproductive years; one with many old people will soon have more deaths. Drawn as bars, one for each age group, men on one side and women on the other, the age structure is an age pyramid.
vii. Population dispersal
Dispersal is the movement of individuals into and out of a population. It happens in three ways:
- Emigration: a one-way movement out of a population, which decreases it.
- Immigration: a one-way movement into a population, which increases it.
- Migration: in animals, the regular, two-way mass movement of a whole population, away and back again, for food, shelter or breeding: Arctic terns, salmon, and bar-headed geese crossing the Himalaya twice a year. In people, any move from one place to live in another is called migration: going out of a country is emigration, coming into one immigration.
So a population changes in four ways: births and immigration add to it, deaths and emigration take away from it.
In a village of 2,000 people, 50 babies were born and 16 people died in a year. What was the birth rate?
Pick an answer to see why.
II. Population dynamics
Population dynamics is how and why the size and density of a population change over time. It rests on three ideas.
- Biotic potential (reproductive potential) is the greatest rate at which a population could grow if nothing held it back: every individual living and breeding as fast as its body allows. It is a theoretical maximum. One bacterium dividing every 20 minutes could leave more descendants in two days than the mass of the Earth.
- Environmental resistance is everything that holds growth back below that maximum: shortage of food, water and shelter, predators, disease, competition, natural disasters.
- Carrying capacity (written K) is the largest population of a species that an environment can support for an indefinite time with its food, water, space and other resources. A population that rises above it, overshooting, falls back.
The largest number of individuals that an environment can support indefinitely is its
Pick an answer to see why.
III. Population census
A population census is the official count of every person in a country at one time, recording facts about each, such as sex, age, education, household, work and industry, which are published as statistics. It is done by the government, usually every 10 years. All the characteristics above, and the dynamics, are worked out from it.
Nepal’s first census was taken in 1911, and since 1952–54 one has been held in every year ending in 1 (except that the 1952–54 census took three years). The National Statistics Office (until 2022 the Central Bureau of Statistics) ran the 12th, in November 2021.
| Census year (AD) | Population | Change | Change (%) | Yearly growth (%) | Doubling time (years) |
|---|---|---|---|---|---|
| 1911 | 5,638,749 | – | – | – | – |
| 1920 | 5,573,788 | −64,961 | −1.2 | −0.13 | – |
| 1930 | 5,532,574 | −41,214 | −0.7 | −0.07 | – |
| 1941 | 6,283,649 | 751,075 | 13.6 | 1.16 | 60 |
| 1952–54 | 8,256,625 | 1,972,976 | 31.4 | 2.30 | 30 |
| 1961 | 9,412,996 | 1,156,371 | 14.0 | 1.65 | 42 |
| 1971 | 11,555,983 | 2,142,987 | 22.8 | 2.07 | 34 |
| 1981 | 15,022,839 | 3,466,856 | 30.0 | 2.66 | 26 |
| 1991 | 18,491,097 | 3,468,258 | 23.1 | 2.10 | 33 |
| 2001 | 23,151,423 | 4,660,326 | 25.2 | 2.27 | 31 |
| 2011 | 26,494,504 | 3,343,081 | 14.4 | 1.36 | 51 |
| 2021 | 29,164,578 | 2,670,074 | 10.1 | 0.96 | 72 |
The yearly growth here is worked out from the counts over whole years between censuses, as compound interest; the National Statistics Office, using the exact census dates, gives 0.92% for 2011–2021. The doubling time is how long the population would take to double at that rate (roughly 70 ÷ the rate in %).
IV. Population features
Two problems threaten human beings more than any others: environmental pollution and population growth.
Environmental pollution is the spoiling of the environment, chiefly the air, water and soil, by harmful substances, pollutants. More people, using more, make more of it.
Population growth is the increase in a population’s size over time. It is measured as a growth curve: plotting the number of individuals (up, on the y-axis) against time (across, on the x-axis) gives a curve that shows how the population grew. There are two kinds of growth curve.
A. The J-shaped curve
The J-shaped (exponential) curve has two phases:
- Lag phase (early phase): with few individuals, the population increases slowly but steadily.
- Log (exponential) phase: with almost no environmental resistance, the population multiplies by the same factor each time (2, 4, 8, 16…), in a geometric pattern, faster and faster, since a larger population adds more individuals than a smaller one.
It is the curve of a population growing at its biotic potential, with nothing to stop it, until it overshoots and crashes all at once, when the resources run out, a frost comes or the season ends. Insects that burst out in the rainy season and vanish after it, and algae blooming in a pond, grow this way.
B. The S-shaped curve
The S-shaped (sigmoid, logistic) curve belongs to a population that meets resistance as it grows and approaches the environment’s carrying capacity. It has three phases:
- Lag phase (early phase, positive acceleration): little growth, because the population is small and still settling into its environment.
- Log phase (exponential phase): fast growth while food and space are plentiful, fastest at half of K.
- Stationary phase (plateau, saturation level, zero growth, negative acceleration): growth slows and stops as resources run short; births equal deaths and the population stays around K.
Yeast in a flask of sugar solution, bacteria in a culture, and sheep brought to Tasmania in the 1800s grew this way.
| J-shaped curve | S-shaped curve | |
|---|---|---|
| Also called | exponential curve | sigmoid or logistic curve |
| Phases | two: lag and log | three: lag, log and stationary |
| Lag phase | early, slow but steady growth | the same |
| Log phase | fast growth in a geometric pattern | the same, slowing as it nears K |
| Stationary phase | absent: growth goes on until a sudden crash | present: births equal deaths, the population stays near K |
| Environmental resistance | almost none until the crash | rises as the population grows |
| Examples | insects in the rains, algal blooms, fruit flies in a jar | yeast, bacteria in culture, sheep in Tasmania, the human population as expected |
The human population has so far grown along something close to a J: faster and faster for two centuries. But its yearly growth has been slowing since the 1960s, and the United Nations expects it to level off, an S-curve, at about 10.3 billion in the 2080s. In exam questions it is the human population that follows the S-shaped curve.
In which phase of the S-shaped curve do births equal deaths?
Pick an answer to see why.
9.1.2 Human population growth: the problem and its control
I. Human population growth
Human numbers grew in three long stages, each raising the carrying capacity of the Earth for people.
- Hunters and gatherers. Until about 10,000 years ago, all people lived by hunting animals and gathering wild food. The world had perhaps 4 million people around 10,000 BC (estimates range from 1 to 15 million).
- Agriculture. Farming began about 10,000 years ago (about 8000 BC). Growing food raised the carrying capacity, and the population rose slowly: about 200–300 million by AD 1, and about 500 million by 1650.
- Industry. The industrial revolution began in Britain from about 1750; with it, and with better farming, transport and, later, medicine, the population entered its exponential phase, which has only now begun to slow.
People obey the same rules of population dynamics as other species. But we can change many of the things that limit us, through farming, industry, medicine and transport, so the size of the human population depends on its food supply, housing and medical care. How people are spread out and how fast they grow depends on geographical factors (climate, water, soil, minerals, sources of energy), social and economic factors (education, income, ethnicity, beliefs) and demographic factors (the stage of the demographic transition).
II. Malthus’s theory of population
T. R. Malthus was the first to set out a theory of human population, in An Essay on the Principle of Population (1798): “Population, when unchecked, increases in a geometrical ratio. Subsistence increases only in an arithmetical ratio.” If people can double every 25 years, they grow as 1, 2, 4, 8, 16…; if food can only be increased by the same amount every 25 years, it grows as 1, 2, 3, 4, 5… After 200 years there would be 256 people for every 9 portions of food.
So, he argued, population is always pushed back to what the food supply allows by two kinds of check:
- positive checks, which raise the death rate: famine, disease, war, poverty;
- preventive checks, which lower the birth rate: “moral restraint”, putting off marriage and having fewer children.
Malthus was right that a population can grow geometrically and that nothing can grow forever on a finite Earth. He was wrong about food: new crops, fertilizers, irrigation and better varieties (the Green Revolution of the 1960s) made food grow faster than people, and the world’s food per person has risen since his day. And he didn’t foresee that people would choose to have fewer children as they grew richer and better educated, which is the demographic transition (9.1.3).
According to Malthus, food supply increases in
Pick an answer to see why.
III. The problem of population growth
i. Growth of the world’s population
Between 1750 and 1850 the population of Europe grew faster than Asia’s, as farming improved and then industry began there first. By 1850 the world had about 1.2 billion people. Between 1850 and 1950 the populations of Asia, Africa and Europe about doubled, while North America’s grew about six times and Latin America’s about five times, partly from immigration from Europe.
The world’s population (estimates before 1950, the middle of published ranges; after it, the UN’s World Population Prospects 2024):
| Year | Population (millions) | Year | Population (millions) |
|---|---|---|---|
| 1650 | about 500 | 1950 | 2,493 |
| 1700 | about 640 | 2000 | 6,172 |
| 1750 | about 790 | 2025 | 8,232 |
| 1800 | about 980 | 2050 | 9,664 (projected) |
| 1850 | about 1,260 | 2100 | 10,180 (projected) |
| 1900 | about 1,630 |
In the 20th century the world added about 45 million people a year on average, most of all about 94 million a year around 1990. It now adds about 70 million a year (69 million in 2025), and this number is falling: the UN expects it to reach zero around 2084, at about 10.3 billion.
By region in 2025 (UN regions):
| Region | Population (millions) | Share of the world (%) |
|---|---|---|
| Asia | 4,835 | 58.7 |
| Africa | 1,550 | 18.8 |
| Europe | 744 | 9.0 |
| Latin America and the Caribbean | 668 | 8.1 |
| North America (United States and Canada) | 388 | 4.7 |
| Oceania (Australia, New Zealand and the Pacific islands) | 47 | 0.6 |
Most of the world’s growth now is in Africa and in South and West Asia.
The most populous countries in 2025:
| Country | Population (millions) | Share of the world (%) | Growing? |
|---|---|---|---|
| India | 1,464 | 17.8 | yes, about 0.9% a year |
| China | 1,416 | 17.2 | no, shrinking slowly since 2022 |
| United States | 347 | 4.2 | slowly, mostly by immigration |
| Indonesia | 286 | 3.5 | yes, about 0.8% a year |
| Pakistan | 255 | 3.1 | yes, fast, about 1.6% a year |
India passed China as the most populous country in 2023.
The time to double:
| Population | Reached about | Years since the last doubling |
|---|---|---|
| 250 million | AD 1 | – |
| 500 million | 1650 | about 1,650 |
| 1 billion | 1804 | about 150 |
| 2 billion | 1927 | 123 |
| 4 billion | 1974 | 47 |
| 8 billion | 2022 | 48 |
The doubling time shrank from over a thousand years to under fifty, and has now stopped shrinking: the next doubling, to 16 billion, isn’t expected at all.
ii. Growth of Nepal’s population
Nepal’s 2021 census counted 29,164,578 people (29.2 million): 14,253,551 males and 14,911,027 females, growing at 0.92% a year, the slowest since the 1930s. The census table and graph are in III above. Its main features:
- growth was slow before 1950, fast from the 1950s to 2001 (2–2.7% a year), and has slowed since;
- families have become much smaller: from about 6 children per woman in 1970 to about 2 now, at or below replacement;
- the death rate fell first (from about 26 to 7 per 1,000), so for decades births were far ahead of deaths: the population more than tripled between 1950 and 2021;
- life expectancy at birth rose from about 38 years in 1950 to about 71 in 2025, and deaths of children under 5 fell from about 340 to about 24 per 1,000 born;
- more and more people live in the Tarai and the cities, and many young people work abroad;
- the people are getting older: the median age has risen from about 18 years in 2000 to about 25 in 2025.
The UN expects Nepal’s population to grow a little more, to a peak of about 36 million around 2067, and then to fall slowly.
iii. Population pressure on human life
A growing population presses on people’s lives in many ways:
- A. Density: as numbers rise in an area, so does its density, and everything there is shared among more people: land, water, roads, schools, hospitals.
- B. Pressure on resources: natural resources (land, water, forests, fish) and man-made ones (housing, jobs, services) are shared more thinly, and some run short for some people.
- C. Intensive agriculture: to feed everyone, extensive and semi-intensive farming are not enough, so land is farmed intensively, with more fertilizer, pesticide and irrigation, which can exhaust the soil.
- D. Moving to the cities: people move from villages and small towns to cities for work and services, adding to the pressure there: Kathmandu Valley’s population rose from about 0.6 million in 1971 to about 3 million in 2021.
- E. More waste: cities and the goods people use daily produce more waste and pollutants than the land and rivers can absorb (the Bagmati in Kathmandu is the clearest example).
- F. Over-consumption: to feed and keep everyone, every commodity available in an area may be used faster than it is replaced.
- G. Grabbing of resources: crowded, needy populations, or powerful ones, have taken land, water and minerals from others, by colonizing them in the past and by force or purchase today.
iv. Causes of population growth
A population grows when births outnumber deaths (and when more people come in than leave). Most of the world’s growth in the last two centuries came from deaths falling while births stayed high. The causes:
- A. Development of agriculture: more food, more reliably, from better crops, fertilizers and irrigation, feeds more people.
- B. Protection from natural disasters: warnings, flood control, sturdier houses and relief work mean fewer deaths from famine, floods, droughts, earthquakes and landslides.
- C. Better storage: grain stores, cold storage and transport carry people through bad harvests and shortages, so famines, which once killed millions, have become rare.
- D. Control of diseases: vaccines, clean water and medicines have controlled epidemics such as smallpox (wiped out worldwide in 1980), cholera, measles and malaria, so fewer people die of infections.
- E. Better health care: medicine, hospitals, trained health workers and medical biotechnology keep people healthier and alive longer.
- F. Treatment of infertility: in vitro fertilization (IVF, “test-tube babies”) helps couples who couldn’t otherwise have children, though it adds very few births to a population.
- G. Polygamy: where a man has several wives, more children may be born to one family; in Nepal polygamy is a crime under the Criminal Code.
- H. Marriage, divorce and remarriage: marrying, and remarrying after divorce, can mean more children in all.
- I. Son preference: families that want a son may keep having children until one is born; this comes from social and economic pressures (inheritance, care in old age, rites), not from any weakness of the couple.
- J. Lack of education and awareness: where people, especially girls, get less schooling and don’t know about or can’t reach family planning, birth rates stay high.
- K. Falling death rate: better food, water, sanitation and medicine have lowered death rates at every age.
- L. Fewer deaths of children: child deaths have fallen sharply, though not to zero: Nepal’s deaths before age 5 fell from about 340 per 1,000 born in 1950 to about 24 in 2025.
- M. Better sanitation: toilets, clean water and hygiene have cut deaths from diarrhea, cholera and typhoid.
- N. Longer lives: life expectancy has risen, so people live longer and more are alive at once.
v. Consequences of overpopulation
When a population outgrows what its area and economy can support:
- A. Shortage of food and safe drinking water, above all for the poorest.
- B. Over-exploitation of natural resources: forests, ground water, fish and soils are used faster than they renew, and some may run out.
- C. Piling up of waste: more use of resources means more waste and pollutants.
- D. Urbanization: villages turn into suburbs and suburbs into cities, often without planning, with slums and traffic.
- E. Unemployment: more people looking for work than there are jobs, one of the main reasons young Nepalis go abroad.
- F. Pollution of air, water and soil, from crowding, traffic, factories and waste.
- G. Natural hazards becoming disasters: crowding doesn’t cause earthquakes or heavy rain, but cutting forests on slopes brings more landslides and floods, and more people living on steep slopes, river banks and in weak buildings means that the same earthquake or flood hurts many more.
- H. Climate change: more people burning more fuel add to the greenhouse gases warming the Earth and changing its temperature and rainfall.
- I. Deforestation: forests are the first to go, cleared for farms and houses and cut for wood.
Which of these is a cause of population growth, not a consequence of it?
Pick an answer to see why.
IV. Controlling population growth
The ways to slow population growth all lower the birth rate, by choice:
A. Raising the age of marriage. Women who marry later have their first child later and usually fewer children in all. In Nepal the legal age of marriage is 20 years for both men and women (the Muluki Civil Code of 2017; the Criminal Code of the same year makes a marriage below that age a crime), yet many, especially girls, still marry younger.
B. Education and awareness. Young people reaching the age of marriage should know the benefits of a small, planned family and how to plan one. Awareness is spread through school, magazines, radio, television, social media and street drama (sadak natak). The education of girls lowers birth rates more than almost anything else: a woman who has finished school usually marries later, has fewer and healthier children, and earns more.
C. Safe abortion. Medical termination of pregnancy (MTP) ends a pregnancy that isn’t wanted, or that would harm the mother. In Nepal it has been legal since 2002, and the Right to Safe Motherhood and Reproductive Health Act, 2075 (2018), sets the limits: with the woman’s consent up to 12 weeks of pregnancy; up to 28 weeks if the pregnancy came from rape or incest, if a licensed doctor finds it endangers her life or her physical or mental health, if the fetus has a serious defect, or if she has HIV or another incurable disease; always by trained providers at approved centers. Amniocentesis, taking a little of the fluid round the fetus with a needle, is done to check the fetus for genetic diseases. Using it, or an ultrasound scan, to find out the sex of a fetus, and ending a pregnancy because of its sex, is a crime in Nepal.
D. Family planning. Family planning is couples deciding how many children to have and when, and using methods of birth control (contraception) to do so. The methods:
I. Natural methods, using no device or drug:
- Safe period (calendar or rhythm) method: avoiding intercourse on the days around ovulation (about days 10–17 of a regular 28-day cycle), when an egg may be present.
- Coitus interruptus (withdrawal): the man withdraws before ejaculation.
- Lactational amenorrhea: full breastfeeding of a baby under 6 months usually delays ovulation.
These cost nothing but fail often.
II. Mechanical methods, devices that keep sperms from reaching or fertilizing the egg (the condoms, diaphragm and cap are barriers):
- Male condom: a thin rubber (latex) sheath over the penis; the only method that also protects against sexually transmitted infections such as HIV. (In Nepal, for example, Dhaal.)
- Female condom: a soft pouch placed in the vagina.
- Diaphragm and cervical cap: soft rubber domes placed over the cervix before intercourse, used with a spermicide.
- Intrauterine devices (IUDs), small devices placed in the uterus by a health worker: the Lippes loop (inert plastic, the first kind), the copper-releasing Copper T (the second kind; its copper harms sperms and eggs, so fertilization rarely happens; works for up to 10–12 years) and the hormone-releasing Progestasert and today’s levonorgestrel IUD (the third kind; it thickens the cervical mucus and thins the endometrium).

III. Chemical methods: spermicides, creams, foams, jellies or foaming tablets put into the vagina before intercourse, which kill sperms; used alone they fail often.
IV. Hormonal methods, using synthetic estrogen and progestin (made like progesterone), which stop ovulation and thicken the cervical mucus:
- Oral pills: a pill a day (in Nepal, for example, the government’s free Nilocon White, or Sunaulo Gulaf from shops); emergency pills after unprotected intercourse.
- Injectables: an injection every three months (Depo-Provera).
- Implants: small, soft rods put under the skin of the upper arm, releasing a progestin for 3–5 years (the first was Norplant; Nepal uses Jadelle and Implanon).

V. Surgical (permanent) methods, sterilization:
- Tubectomy (tubal ligation) in women: each fallopian tube is cut and tied or blocked, through a small cut in the abdomen (minilaparotomy) or by laparoscope.
- Vasectomy in men: each vas deferens is cut and tied through a tiny opening in the scrotum (Unit 24); quicker and safer than a tubectomy.
How well they work. Out of 100 women using a method for a year in the usual way, about how many become pregnant? (Trussell and others, as given by WHO.)
| Method | Pregnancies per 100 women a year (typical use) |
|---|---|
| implant | under 1 |
| vasectomy, tubectomy | under 1 |
| IUD (copper or hormone) | under 1 |
| injectable | about 4 |
| pills | about 7 |
| male condom | about 13 |
| withdrawal | about 20 |
| spermicide | about 21 |
| calendar method | about 15–24 |
| no method | about 85 |
Which of these is a permanent method of birth control in men?
Pick an answer to see why.
9.1.3 The demographic cycle
I. Demographic transition
The demographic transition is the change, seen in country after country, from high birth and death rates to low birth and death rates as societies gain technology, education and wealth. Deaths fall first, with better food, water and medicine; births fall later, as fewer children die, schooling spreads, people move to towns and women work and choose smaller families. In between, births far outnumber deaths, and the population grows fast. This transition has happened in most of the world over the last two centuries: it brought the unmatched growth after Malthus’s time, and it is now slowing growth in every region.
II. The demographic cycle
The demographic cycle (population cycle) is the course of a population through the transition, for a region, a country, a continent or the world. Drawn from the history of the industrialized countries, it has five stages:
- i. First stage, high stationary. High birth rate and high death rate; the population stays about the same, growing slowly if at all. The world before about 1750; India until about 1920; Nepal, whose censuses barely changed from 1911 to 1930.
- ii. Second stage, early expanding. The death rate falls fast with better food, clean water and medicine, while the birth rate stays high; the population grows fast. Many of the poorest countries of Africa today (Niger, Chad) are near the end of this stage.
- iii. Third stage, late expanding. The birth rate falls too, with contraception, schooling and women’s empowerment, but is still above the death rate, so the population still grows. India, Bangladesh and Nepal are in this stage.
- iv. Fourth stage, low stationary. Low birth rate and low death rate; the population grows little, and gets older. Sweden, Belgium, Denmark, Norway, Switzerland, the United States and China until recently.
- v. Fifth stage, declining. The birth rate falls below the death rate, and the population shrinks unless immigrants arrive. Japan, Italy, Germany, Hungary and Bulgaria; China since 2022.
The fifth stage wasn’t in the original theory (it had four); it was added when birth rates in parts of Europe and East Asia fell below death rates, as they had never been expected to.
In which stage of the demographic cycle are both the birth rate and the death rate high?
Pick an answer to see why.
Exercise
A. Tick the correct alternatives
- The study of human population is
Pick an answer to see why.
- The human population is studied under
Pick an answer to see why.
- The maximum number of individuals that an environment can support is its
Pick an answer to see why.
- Which term means the birth rate of a population?
Pick an answer to see why.
- Natality is related to the ………… of individuals.
Pick an answer to see why.
- Mortality refers to the ………… of individuals.
Pick an answer to see why.
- The S-shaped growth curve is expected to apply to which of the following?
Pick an answer to see why.
- Overpopulation has harmful effects on society. Which of the following can control it?
Pick an answer to see why.
- Which of the following is a strategy for controlling overpopulation?
Pick an answer to see why.
- How many stages are there in the demographic cycle?
Pick an answer to see why.
- The vas deferens carries sperms from the tail of the epididymis to the ejaculatory duct. What happens when a man’s vasa deferentia are cut and tied in surgery?
Pick an answer to see why.
B. Answer the following questions in brief
Fill in the world’s human population in Table A. Then use Table B, the UN’s figures, to answer the questions below it.
Table A
| Year | Human population |
|---|---|
| AD 1 | |
| 1000 | |
| 1800 | |
| 1927 | |
| 1960 | |
| 1974 | |
| 1987 | |
| 1999 | |
| 2050 |
Table B
| Year | World population (billions) |
|---|---|
| 1750 | 0.8 |
| 1800 | 1.0 |
| 1850 | 1.3 |
| 1900 | 1.6 |
| 1950 | 2.5 |
| 1960 | 3.0 |
| 1970 | 3.7 |
| 1980 | 4.4 |
| 1990 | 5.3 |
| 2000 | 6.2 |
| 2010 | 7.0 |
| 2020 | 7.9 |
| 2030 | 8.6 (projected) |
| 2050 | 9.7 (projected) |
| 2100 | 10.2 (projected) |
- a.Draw a graph of Table B with a sharp pencil and a ruler, taking care with the scale of years. Plot each point as a small cross, then draw a smooth curve through them.
- b.Use your graph to estimate the population in 1955.
- c.What is the difference between an estimate and a prediction?
- d.The population took about 120 years to double from 1 to 2 billion. Use your graph to find how long it took to double again, to 4 billion.
- e.How has the growing human population affected the Earth’s resources?
Answer
Draw and explain in short the growth curves of a population.
Answer
State briefly the problems of overpopulation.
Answer
Mention the causes of overpopulation.
Answer
Explain in brief the measures to control human population growth.
Answer
Draw and describe in short Malthus’s theory of population.
Answer
State in brief the growth and features of the world’s human population.
Answer
Discuss in short the growth and features of Nepal’s human population.
Answer
Point out the pressure of the human population on human life.
Answer
C. Long answer questions
What is a population? What is a population census? Describe in detail the characteristics of a human population.
Answer
When is World Population Day observed? Give a detailed account of human population census and dynamics.
Answer
What is a population growth curve? Draw and explain the growth curves of populations, with suitable examples.
Answer
What is demography? Who is a demographer? Write in detail the causes of human population growth, the problems of population growth and the strategies to control overpopulation.
Answer
What is the demographic transition? What is the demographic cycle? Explain the human demographic cycle in detail.
Answer
What is family planning? Write a detailed account of the family planning methods used in Nepal, with a comment on the Family Planning Association of Nepal (FPAN) and the Nepal CRS Company.
Answer
Printable PDFs
- Study notes 5 pages
- Worksheet 4 pages Answer key
Quiz yourself: Environment and Biodiversity, Grades 5–12 →
Practice every question in the book, and keep track of the ones you miss →
A companion to your textbook, not a replacement for it: study from the book your school uses, and where the two differ, follow your teacher. Found a mistake? Please tell us.