
Ask your grandparents how many people lived in Nepal when they were young. Nepal’s first census, in 1911, counted 5,638,749 people. The census of 2021 counted 29,164,578, about 2.9 crore: 5.2 times as many in 110 years. So what comes next? If Nepal kept “doing what it has been doing”, it would multiply by 5.2 again and reach about 15 crore people by 2131. But “doing what it has been doing” can mean adding the same number of people every year, or growing by the same percentage, or something else again, and each gives a different future.
There have been twelve censuses, and the widget below draws them all. Before any formulas, make a guess.
Guess first. The United Nations’ demographers, the people whose job is to forecast populations, expect Nepal’s population to stop growing. When?
Pick an answer to see why.
Three ways to carry on
A mathematical model of a population is a formula that gives its size for any year. To choose one, we draw the counts and try formulas through them. Each formula below is made to pass through the 2021 count exactly; you choose how it behaves before and after.
Notice the surprise. The formula Grade 10 used for population growth, the same percentage every year, is the worst of the three at describing Nepal. To see why, look at the counts more closely.
Adding or multiplying?
Here is each step from one census to the next, worked out as people added per year and as a percentage per year (the compound rate that turns one count into the next):
| From | To | People added a year | Growth a year |
|---|---|---|---|
| 1911 | 1920 | −7,218 | −0.13% |
| 1920 | 1930 | −4,121 | −0.07% |
| 1930 | 1941 | 68,280 | 1.16% |
| 1941 | 1952/54 | 164,415 | 2.30% |
| 1952/54 | 1961 | 144,546 | 1.65% |
| 1961 | 1971 | 214,299 | 2.07% |
| 1971 | 1981 | 346,686 | 2.66% |
| 1981 | 1991 | 346,826 | 2.10% |
| 1991 | 2001 | 466,033 | 2.27% |
| 2001 | 2011 | 334,308 | 1.36% |
| 2011 | 2021 | 267,007 | 0.96% |
(The 1952/54 census was taken in two parts over two years; we place it at 1953.)
The two kinds of model test the two columns.
- A linear model, P = a + mt, adds the same number of people, m, every year. Its graph is a straight line, and m is the line’s slope. If Nepal were linear, the middle column would be the same all the way down.
- An exponential model, , multiplies by the same growth factor b every year: growth of 2% a year is b = 1.02. If Nepal were exponential, the last column would be the same all the way down.
Neither column is steady. The people added each year rose to a top in the 1990s and then fell; the percentage rose to a top in the 1970s, and since the 1990s it has fallen fast. That last column is the clue: whatever Nepal is doing, its rate of growth is falling.
Every model has numbers that mean something, its parameters. In the linear model, m is people a year. In the exponential, b − 1 is the rate, and it also fixes the doubling time: at 0.965% a year Nepal would double in about 72 years, since . (A quick rule: 70 divided by the rate in percent, 70 ÷ 0.965 ≈ 73.) So “the same percentage” isn’t a mild assumption: it promises 5.8 crore people by about 2093, 11.7 crore by about 2165, and so on for ever.
How far off is a model?
At each census the gap between the count and the model is called a residual: count minus model, positive when the model is too low. The widget’s typical miss is the root-mean-square of the residuals: square each, average them, take the square root. Squaring stops a miss of +5 lakh and one of −5 lakh from canceling, and counts big misses heavily. The best fit is the setting that makes it smallest.
The residuals’ pattern matters as much as their size. For the best straight line, the residuals at 1961–2021 are +6.8, −5.8, −5.2, −4.6, +8.0, +7.3 lakh and 0: the line is too low at the start, too high in the middle and too low near the end. A model that fits well leaves residuals that look like random scatter; a run of misses all on one side means the model has the wrong shape.
A model of a town’s population has residuals (count minus model) of −3, −1, +2, +4, +2, −1, −4 thousand at seven censuses in a row. What do they tell you?
Pick an answer to see why.
The S-curve
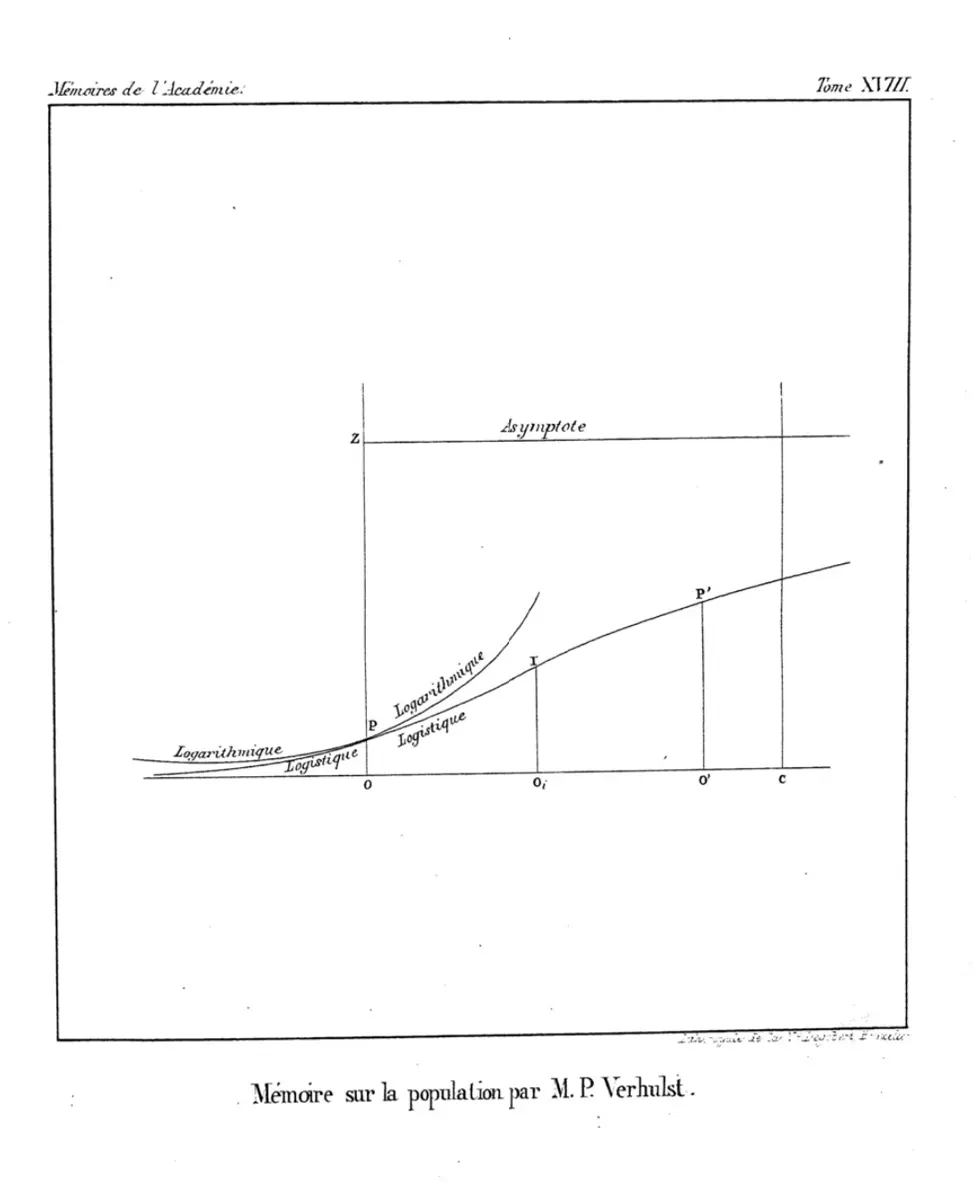
In 1838 a Belgian mathematician, Pierre-François Verhulst, asked what happens if a population’s rate of growth falls as the population rises. The simplest such rule: the rate falls in a straight line, from some starting rate r when the population is tiny, down to zero at a ceiling K:
When P is small, the bracket is nearly 1 and the population grows almost exponentially. As P nears K, the bracket nears 0 and growth dies away. The population that results is the logistic model,
where P₀ is the population at t = 0. Its graph is an S, flat at the start, steep in the middle, flat again at the top. Ecologists call K the carrying capacity, the most that a place can support. The widget’s S-curve is this formula, started from the 2021 count.
Verhulst’s idea also gives a way to read K straight from the data. If the rate really falls in a straight line as P rises, then a graph of rate against population is a straight line, and where it reaches zero is the ceiling.
So the S-curve says Nepal is about four-fifths of the way to a ceiling a little over 3.5 crore. The widget’s best S-curve, fitted to the counts themselves, had its ceiling at 3.86 crore. The two methods roughly agree, and the UN’s peak, 3.58 crore, is between them.
Why the steepest part is halfway up
In an S-curve the number of people added in a year is the rate times the population:
The two numbers P and K − P always add up to K. Of two numbers with a fixed sum, the product is largest when they are equal: with K = 100, 40 × 60 = 2{,}400, 45 × 55 = 2{,}475, 50 × 50 = 2{,}500. (In general , and a square is never negative.) So an S-curve adds the most people a year when it is halfway to its ceiling, at P = K/2, and two populations equally far below and above K/2 add the same number.
Check it against Nepal. The most people added a year was 466,033, from 1991 to 2001, when the population was about 2.07 crore. Half of a ceiling of 3.5 to 3.86 crore is 1.75 to 1.93 crore. Close enough to be a good sign for the S-curve, if a little late.
The twist: a good fit is not a good reason
The S-curve fits Nepal’s past better than any other simple formula and gives a sensible-looking ceiling. Should we believe it? History says: be careful.
In 1920 two American scientists, Raymond Pearl and Lowell Reed, fitted a logistic curve to the US censuses of 1790 to 1910 and found that it described them “with a substantial degree of accuracy”. Their curve said the United States had passed its fastest growth in about 1914, and that its population could never pass a ceiling of 197,274,000. “While prophecy is a dangerous pastime”, they wrote, they believed the 1920 census would confirm it. The US census of 2020 counted 331,449,281 people, 68% more than the “ceiling”. Verhulst’s own curve, fitted to Belgium, gave a ceiling of about 9.4 million; Belgium had about 11.9 million people in 2026.
What went wrong? A curve that fits is only a description. The logistic’s ceiling is a guess at how many people the land can feed, but a country isn’t a jar of yeast: farming, trade, medicine and migration move the “ceiling” all the time.
And for Nepal there is a second problem. An S-curve can only level off: it never comes down. The UN expects Nepal’s population to fall after 2067. To see why, look at what really slowed Nepal down.
What really slowed Nepal down
Nepal’s rate didn’t fall because the country ran out of room or food. It fell because families chose to have fewer children, and because many young people went abroad to work.
- Births. In the UN’s estimates a woman in Nepal had about 6 children on average in 1950, about 4 in 2000 and about 1.9 in 2025. This average is the total fertility rate. About 2.1 is the replacement level, the rate at which each generation of parents is replaced by one of children the same size.
- Migration. The UN estimates that from 2022 to 2025 about 4 lakh more people a year left Nepal than came in, more than births exceeded deaths, so by its count Nepal’s population actually shrank a little in those years. Its forecast assumes the outflow drops to about 30,000 a year from 2028; if it stays high, Nepal peaks sooner and lower.
So why should Nepal keep growing until 2067, when women already have fewer than 2.1 children? Because of who is alive now. The many children born when families were large are now young adults having children of their own. Even with small families, so many parents give more births than deaths, for decades. Demographers call this population momentum. In the UN’s forecast, births in Nepal stay ahead of deaths until about 2070; only then, as that big generation grows old, do deaths overtake births and the population begins to fall.
None of this is in the counts alone. No formula fitted to twelve numbers can see a change in how many children people choose to have.
What the demographers do
The UN, and every other major forecaster, uses the cohort-component method. They don’t fit a curve to the total. They split the population by age and sex (all the girls aged 0–4, all the men aged 60–64, and so on) and step forward a year at a time: each group grows a year older, loses those expected to die at that age, gains or loses migrants, and the women of each age have the expected number of babies, who become the new 0-year-olds. The forecast is only as good as its guesses about future births, deaths and migration, so the UN gives a range as well as a middle forecast.
The fan in Figure 33.2 is the honest answer to the topic’s question. The middle forecast says the 2060s. But the range is wide: by 2100 the UN gives a 95% chance that Nepal will have between about 1.1 and 6.3 crore people. Much of that width comes from one number, the children per woman. In the UN’s “low” variant, where women have half a child fewer than in the middle forecast, Nepal peaks in 2048 at about 3.15 crore. In its “high” variant, half a child more, Nepal is still growing in 2100, at about 4.95 crore.
Nepal’s own National Statistics Office made its projection from the 2021 census, assuming 1.72 children per woman, and expects about 3.35 crore people by 2108 BS (2051–52 AD), thirty years after the census: about 13 lakh below the UN’s 3.48 crore for 2051. Two careful forecasts made with the same census differ by over a million people in thirty years: that is the size of the uncertainty.
Where this is used
- Planning a country. The UN’s World Population Prospects forecasts every country’s population. Its 2024 report calls an understanding of population trends “critical” for “designing policies that require a longer time horizon, such as those related to macroeconomic planning, social protection, national security and the environment”. The UN, the Wittgenstein Centre in Vienna and the Institute for Health Metrics and Evaluation in Seattle, the three groups that forecast the whole world’s population, all use the cohort-component method.
- Nepal’s own forecasts. The National Statistics Office made its own projection from the 2021 census, with its own assumptions about children per woman and Nepalis living abroad.
- The world. The UN’s middle forecast for the world peaks at about 10.3 billion in the mid-2080s, and it says 63 countries and areas, among them China, Japan and Germany, have already passed their peaks.
Questions
★ A town’s population grows by 450 people every year. Which kind of model fits it?
Pick an answer to see why.
At Nepal’s growth of 2011–2021, 0.965% a year, about how long would the population take to double? Check your answer by working out 1.00965 to the power of your answer.
Answer
Here are three tables. Which is linear, which exponential, which neither? Give the slope or the growth factor where there is one.
- i.1, 2, 3, 4 years: 200, 260, 338, 439.4
- ii.1, 2, 3, 4 years: 200, 260, 320, 380
- iii.1, 2, 3, 4 years: 200, 260, 300, 320
Answer
For an S-curve with ceiling K = 4 crore and r = 4%, how many people does it add in a year when the population is 1 crore, 2 crore and 3 crore? Which is most, and why?
Answer
Pearl and Reed’s curve put the United States’ ceiling at 197,274,000. The 2020 census counted 331,449,281. By what percentage did the country pass its “ceiling”? Name two things their curve couldn’t know about.
Answer
A country has 10 million people, all children have been born to parents in their 20s, and families have just dropped from 3 children per couple to 2. Explain, without a formula, why its population will still grow for many years.
Hint
Answer
In the RateLine widget, all nine steps give a ceiling of 9.27 crore, and the last three give 3.26 crore. Look at the dots. Why does including the early steps make such a difference, and which answer is more believable?
Answer
Where to go next
- What Is e, and Why Does Growth Keep Finding It? Where the e in the logistic formula comes from.
- How Many Tigers Can Chitwan Hold? (Going Further, Grades 9–12) The same logistic model, for Nepal’s tigers.
- Can 1,000 People Speak for 3 Crore? How surveys between censuses estimate a whole country.
- How Much Rain Falls on the Kathmandu Valley? Another model built from Nepal’s own numbers.
- How Much Rice Is on the Chessboard? (Grades 6–8) How quickly doubling runs away.
- How Does a Cold Spread Through a School? (Computing, Going Further, Grades 6–8) An outbreak’s S-curve, simulated.
- Grade 10 Math: Growth The same-percentage formula, and Nepal’s censuses.
Where these facts come from
- The twelve census counts, 1911–2021: Wikipedia, “Census in Nepal”, the National Statistics Office’s table, as used in Grade 10’s growth unit, read October 2026. All the table’s rates, the fitted models, the residuals and the ceilings were computed by us from them.
- The UN’s projections for Nepal (the medium variant, the peak in 2067 at 35.80 million, 34.64 million in 2050, 31.83 million in 2100; the low and high variants, half a child fewer or more by 2035; the 80% and 95% ranges; total fertility 6.06 in 1950, 3.98 in 2000, 1.94 in 2025; net migration 2022–2025 and its fall to about 30,000 a year from 2028; 34.78 million in 2051; births minus deaths turning negative about 2070; infant deaths per 1,000 in 1950 and 1980): United Nations, World Population Prospects 2024, the files WPP2024_Demographic_Indicators_Medium.csv.gz and WPP2024_Demographic_Indicators_OtherVariants.csv.gz, downloaded October 2026.
- The world’s peak, 63 countries past their peak, the replacement level of 2.1, momentum, the cohort-component method used by the UN, the Wittgenstein Centre and IHME, the quotation on planning, and Nepal’s peak year and size in its table: United Nations, World Population Prospects 2024: Summary of Results, read October 2026.
- The National Statistics Office’s projection (3.35 crore by 2108, 1.72 children per woman): Republica, “Nepal’s population expected to reach 33.5 million by 2108”, 26 March 2025, read October 2026. It doesn’t name the calendar, but its growth rates run “over the next three decades” and its absent population from “2078”, the census year in BS; a second Republica report of the same projections, “Children’s share projected to drop to 22 percent by 2108 BS”, says “over the next 30 years—by 2108 BS”. The NSO’s report itself could not be found online.
- Raymond Pearl and Lowell J. Reed, “On the rate of growth of the population of the United States since 1790 and its mathematical representation”, PNAS 6 (1920), 275–288 (archived PDF): the ceiling of 197,274,000, the turn about 1914, the quotations, read October 2026.
- The US population of 331,449,281 on 1 April 2020: US Census Bureau, “2020 Census Apportionment Results”, read October 2026.
- Verhulst’s life, his papers of 1838 and 1845, the name logistique, Belgium’s ceiling of about 9.4 million, Quetelet’s criticism and the rediscovery by Pearl and Reed: MacTutor, “Pierre François Verhulst”, read October 2026.
- Belgium’s population of 11,867,634 on 1 January 2026: Statbel, “Structure of the population”, read October 2026.