
Kathmandu and Pokhara are only about 140 km apart in a straight line. Yet ask anyone from Pokhara about the monsoon, and they will tell you their city gets far more rain. Is that true? In which months? And is Pokhara warmer too?
Weather scientists have measured both cities for decades. Here are the averages for each month: rain in millimeters, and the temperature in degrees Celsius, the average of day and night.
| Month | Rain, Kathmandu (mm) | Rain, Pokhara (mm) | Temp., Kathmandu (°C) | Temp., Pokhara (°C) |
|---|---|---|---|---|
| Jan | 15 | 22 | 11.0 | 13.5 |
| Feb | 24 | 35 | 13.7 | 16.2 |
| Mar | 38 | 64 | 17.4 | 20.1 |
| Apr | 63 | 142 | 20.5 | 23.1 |
| May | 129 | 355 | 22.7 | 24.6 |
| Jun | 241 | 648 | 24.4 | 26.0 |
| Jul | 384 | 941 | 24.5 | 26.4 |
| Aug | 343 | 839 | 24.6 | 26.4 |
| Sep | 208 | 635 | 23.7 | 25.5 |
| Oct | 43 | 159 | 20.6 | 22.6 |
| Nov | 6 | 17 | 16.0 | 18.4 |
| Dec | 8 | 12 | 12.2 | 14.7 |
The averages over the 30 years 1991–2020, measured at the airports of Kathmandu and Pokhara.
That is 48 numbers. Look at them for ten seconds: can you tell which city is wetter, by how much, and in which months? It is hard. In this unit you learn two pictures that make such tables easy to read at a glance: the line graph and the multiple bar graph. In Back to Kathmandu and Pokhara you will draw both.
21.0 Review
A stationery shop wrote down how many books it sold each day for a month (30 days):
13, 14, 13, 16, 18, 20, 13, 25, 10, 18, 12, 10, 28, 25, 12, 15, 17, 15, 25, 24, 20, 10, 25, 18, 20, 22, 18, 15, 13, 20
In a cumulative frequency table, the row for 18 books says 19. What does the 19 mean?
Pick an answer to see why.
21.1 Line graph
A line graph shows how a number changes, from one day, month or year to the next. Each value is a dot, placed straight above its name at its height on the scale; then the dots are joined, in order, by straight lines. The slope of each piece of line tells the story at a glance:
- a line going up means the number rose;
- a line going down means it fell;
- a flat line means it stayed the same;
- the steeper the line, the bigger the change.
Before you look at the solution, draw it yourself here. Drag each dot to its number, then press Check.
Which of these should be shown as a line graph rather than a bar graph?
Pick an answer to see why.
On a line graph of a shop’s sales, the line from Monday to Tuesday is flat. What does that mean?
Pick an answer to see why.
Exercise 21.1
Question 1
The line graph shows the temperature in Kathmandu at the same time on six days. Study it and answer.
Which day has the highest temperature?
Answer
Which day has the lowest temperature?
Answer
What is the temperature on Wednesday?
Answer
Show the line graph as a frequency table.
Answer
Question 2
The number of new students in Grade 7 of a basic school over five years is in the table. Show it in a line graph.
| Year (BS) | 2074 | 2075 | 2076 | 2077 | 2078 |
|---|---|---|---|---|---|
| New students | 20 | 26 | 18 | 14 | 12 |
Answer
Question 3
A Grade 7 class was asked how they protected themselves from COVID-19. Show their answers in a graph. Which kind of graph is right for this data?
| Protection | Mask | Sanitizer | Face shield | Gloves | Soap |
|---|---|---|---|---|---|
| Students | 30 | 22 | 18 | 8 | 25 |
Answer
Question 4
Show each table in a line graph.
| Class | Students |
|---|---|
| 1 | 26 |
| 2 | 24 |
| 3 | 28 |
| 4 | 40 |
| 5 | 35 |
| 6 | 45 |
| 7 | 50 |
Answer
| Quantity (kg) | 2 | 4 | 6 | 9 | 12 |
|---|---|---|---|---|---|
| Price (Rs.) | 500 | 1000 | 1500 | 2250 | 3000 |
Answer
Question 5
Measure the temperature at school with a thermometer at 10 a.m., 12 noon, 2 p.m. and 4 p.m. on one day, and show it in a line graph.
Answer
21.2 Multiple bar graph
Students were asked which game they like best. Here is a bar graph of their answers.
A simple bar graph shows one set of numbers. Often we want to compare two or three sets side by side: girls and boys, this year and last year, Kathmandu and Pokhara.
In Example 2, in which class did more students get grade C than grade B?
Pick an answer to see why.
A graph shows two bars for each year: rice and wheat. What is the best name for it?
Pick an answer to see why.
Exercise 21.2
Question 1
Show each table in a multiple bar graph.
The fish and meat a shop sold (kg) on six days:
| Day | Fish (kg) | Meat (kg) |
|---|---|---|
| Sunday | 10 | 18 |
| Monday | 15 | 12 |
| Tuesday | 17 | 20 |
| Wednesday | 19 | 22 |
| Thursday | 20 | 25 |
| Friday | 27 | 20 |
Answer
The boys and girls in five schools:
| School | A | B | C | D | E |
|---|---|---|---|---|---|
| Boys | 250 | 125 | 310 | 425 | 520 |
| Girls | 210 | 175 | 350 | 400 | 550 |
Answer
Question 2
The way students come to school is in the table. Show it in a multiple bar graph.
| Way to school | On foot | Bus | Motorcycle | Bicycle |
|---|---|---|---|---|
| Boys | 25 | 40 | 20 | 55 |
| Girls | 30 | 45 | 15 | 60 |
Answer
Question 3
The multiple bar graph shows the paddy and wheat produced in five provinces, in thousands of metric tons. The numbers are for practice, not the real harvest.
Which province produced the most paddy (rice)?
Answer
Which province produced the most wheat?
Answer
Which province produced equal amounts of paddy and wheat?
Answer
Which province produced the least paddy?
Answer
Question 4
The multiple bar graph shows a school’s SEE results over three years. Answer the questions.
How many students got A+ in 2075 BS?
Answer
How many students got A in 2076 BS?
Answer
In which year did the most students get A+?
Answer
In which year did the fewest students get B?
Answer
Mixed exercise
Question 1
The highest temperature of a city on seven days of Baishakh is in the table.
| Date (Baishakh) | Highest temperature (°C) |
|---|---|
| 16 | 35.5 |
| 17 | 37 |
| 18 | 36 |
| 19 | 32 |
| 20 | 30 |
| 21 | 33 |
| 22 | 34.5 |
Make a bar graph of the data.
Answer
Show the data in a line graph, and answer: (i) Which is the hottest day? (ii) What is the highest temperature on the 20th? (iii) By how much did the temperature change over the week? (iv) What is the difference between the highest and the lowest of these temperatures?
Answer
Question 2
The line graph shows the interest rate a bank gave on fixed deposits.
Which year had the highest interest rate?
Answer
Which year had the lowest interest rate?
Answer
Which years had equal interest rates?
Answer
Make a bar graph of the data.
Answer
Question 3
The people of a village over five years, in hundreds:
| Year (BS) | 2073 | 2074 | 2075 | 2076 | 2077 |
|---|---|---|---|---|---|
| Female | 12 | 13 | 14 | 17 | 17 |
| Male | 11 | 14 | 15 | 13 | 11 |
In which years were there more males than females?
Answer
Over the five years together, by what percentage were the females more than the males?
Answer
In which years were the numbers of males and females equal?
Answer
Question 4
The multiple bar graph shows the potatoes and cauliflowers a shop sold over four weeks.
How many kilograms of potatoes were sold in the first week?
Answer
In which week were equal amounts of potatoes and cauliflowers sold?
Answer
In which week were the most cauliflowers sold?
Answer
In which week were the fewest potatoes sold?
Answer
How many kilograms of potatoes and cauliflowers together were sold in the fourth week?
Answer
By what percentage were the cauliflowers sold in the third week more than in the second week?
Answer
Which vegetable’s sales went up and down the most?
Answer
Printable PDFs
- Study notes 2 pages
- Harder practice questions 2 pages Answer key
Practice every question in the book, and keep track of the ones you miss →
Back to Kathmandu and Pokhara
First the temperature. The months come in order, so a line graph fits. Two lines on one graph compare the cities:
The two lines have the same shape: coldest in January, warmest from June to August. But Pokhara’s line is above Kathmandu’s in every month, by about 2 °C. Pokhara is lower: its weather station is about 830 m above sea level, against about 1,340 m at Kathmandu’s airport, and lower places are usually warmer.
Now the rain in the monsoon months. Here we compare two cities, month by month, so a double bar graph fits:
The answer jumps out: in every month Pokhara’s bar is between two and four times as tall as Kathmandu’s. In July, Pokhara gets about 941 mm, nearly a meter of water, against Kathmandu’s 384 mm. Over the whole year, Pokhara gets about 3,900 mm and Kathmandu about 1,500 mm. The people of Pokhara are right.
Where this is used
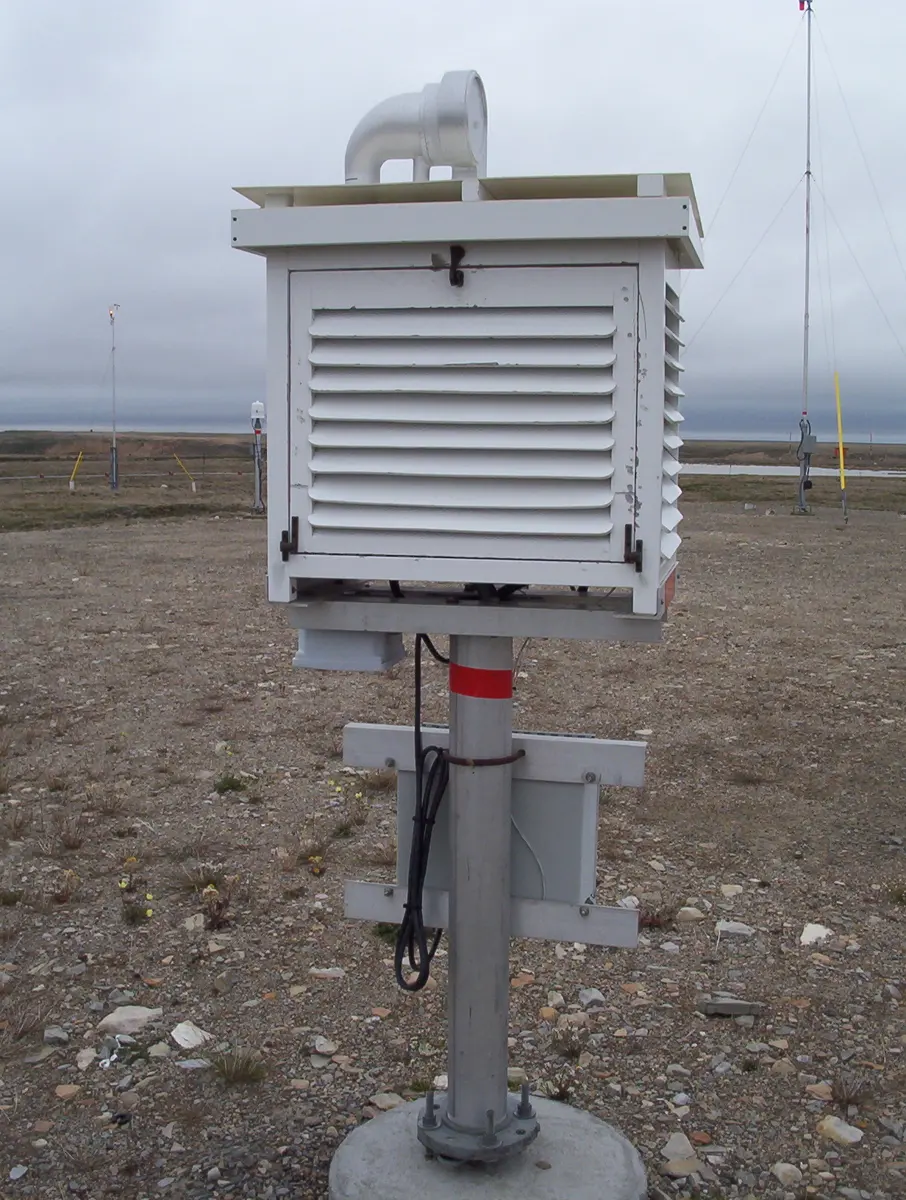
- Weather. Nepal’s Department of Hydrology and Meteorology measures temperature and rain at stations across the country. Climate tables like the one at the top of this unit are made from those measurements, and weather pages draw them as line graphs and bar graphs.
- Health. A child’s weight and height, plotted at every check-up, make a line on a growth chart, compared with the lines of healthy children of the same age.
- Business. A shop owner draws sales month by month, as in Example 1, to see which months need more stock.
- News. Newspapers show exam results, prices and populations year by year as line graphs, and compare provinces or groups with multiple bar graphs.
Where these facts come from
- Kathmandu’s climate: Wikipedia, “Kathmandu”, climate table for Tribhuvan International Airport, 1991–2020 normals (from the World Meteorological Organization and Nepal’s Department of Hydrology and Meteorology): mean temperature and precipitation for each month, read November 2026.
- Pokhara’s climate: Wikipedia, “Pokhara”, climate table, 1991–2020 normals (same sources): mean temperature and precipitation for each month, read November 2026.
- Growth charts: Wikipedia, “Growth chart” (a child’s height, weight and head size compared with those of healthy children of the same age and sex), read November 2026.
- The two weather stations’ heights: the same climate tables (Tribhuvan International Airport, 1,337 m; Pokhara Airport, 827 m), read November 2026. The distance between the cities, about 142 km, worked out from their coordinates in the same articles.
A companion to your textbook, not a replacement for it: study from the book your school uses, and where the two differ, follow your teacher. Found a mistake? Please tell us.