
Your class teacher asks all 30 students one question: “What did you eat this morning, before school?” She writes each answer on the board as it comes.
Noodles, dal bhat, chiura, only tea, dal bhat, only tea, roti, dal bhat, roti, dal bhat, only tea, noodles, bread, roti, noodles, bread, chiura, dal bhat, chiura, bread, chiura, roti, dal bhat, chiura, dal bhat, dal bhat, noodles, roti, dal bhat, roti
What did the most students eat? How many came to school with only a cup of tea? The answers are all on the board, but you can’t see them at a glance.
In this unit you will learn to count a list like this once, quickly and without mistakes, and then to draw it so that anyone can read it in a second. In Back to breakfast you will do both for this board.
20.0 Review
A table is easier to read than a list. Here is how much of each food Rabina’s family used in Baishakh, 2076.
| S.N. | Food | Quantity (kg) |
|---|---|---|
| 1. | Potato | 10 |
| 2. | Peas | 3 |
| 3. | Salt | 2 |
| 4. | Sugar | 5 |
| 5. | Rice | 40 |
| 6. | Spices | 1 |
| 7. | Pulses | 7 |
| 8. | Beaten rice (chiura) | 6 |
In Grade 5 you made tables like this from lists, counted with tally marks, and drew bar diagrams. This unit names each step and makes it exact.
20.1 Frequency table
The words
Facts or numbers collected about something are called data (तथ्याङ्क). Data can be about things you can touch (kilograms of rice) or things you can’t (a favorite vegetable).
Data written down as they were collected, in no order, like the list in Activity 1, are raw data (प्रारम्भिक तथ्याङ्क).
The number of times an answer comes in the data is its frequency (बारम्बारता). In Activity 1, the frequency of cauliflower is 8.
The strokes you make while counting are tally marks, also called tally bars (मिलान चिह्न). Every fifth one goes across the four before it, so they are counted in fives.
A table that lists every answer in the raw data with its tally marks and its frequency is a frequency table (बारम्बारता तालिका).
In the raw data “3, 5, 3, 4, 3, 5”, what is the frequency of 3?
Pick an answer to see why.
A frequency table has the frequencies 7, 4, 9 and 5. How many answers were in the raw data?
Pick an answer to see why.
Numbers as data
Data are often numbers: marks, heights, amounts. Then write the values in the frequency table in order, smallest first, so a reader can find a value quickly.
Exercise 20.1
Question 1
Here are the marks of 30 students of Grade 6 of Shreekrishna Secondary School in a mathematics test out of 20.
2, 14, 9, 6, 13, 7, 8, 11, 12, 9, 5, 4, 15, 19, 20, 17, 16, 13, 20, 19, 15, 9, 15, 12, 17, 13, 18, 19, 16, 15
Show the marks in a frequency table with tally marks.
Answer
Question 2
Here are the heights, in centimeters, of 32 students of Grade 2.
123, 122, 121, 120, 124, 120, 122, 121, 120, 123, 120, 122, 124, 123, 121, 124, 120, 124, 122, 121, 123, 122, 123, 123, 122, 121, 120, 124, 120, 121, 123, 122
Show the heights in a frequency table with tally marks.
Answer
Question 3
Here are the daily wages, in rupees, of the workers of a shoe factory.
170, 200, 150, 180, 220, 170, 190, 160, 220, 200, 150, 180, 160, 220, 210, 180, 210, 200, 180, 160, 180, 170, 200, 150, 180, 210, 220, 190, 180, 170, 160, 180, 150, 200, 220, 190, 180, 170, 180, 160
Show the wages in a frequency table with tally marks.
Answer
Question 4
The students of Grade 6 of Bhagyodaya Basic School come to school on foot or in other ways. Here is how each of them comes.
Bus, cycle, cycle, taxi, bike, foot, bus, foot, taxi, foot, bus, foot, taxi, foot, foot, cycle, bike, foot, cycle, cycle, taxi, taxi, bus, cycle, bus, taxi, foot, foot, bus, bike, foot, bus, bike, bike, bus, foot, taxi, bus, cycle, foot
Show the data in a frequency table with tally marks, and answer the questions.
In which group are the most students?
Answer
In which group are the fewest students?
Answer
How many students come to school on foot?
Answer
Which groups have the same number of students, and how can you tell?
Answer
How many students are there in the class in all?
Answer
20.2 Simple bar diagram
A frequency table tells you the exact numbers. A picture can show which is biggest before you read a single number.
Students of a school were asked, “Which color do you like most?” Their answers are drawn below.
A diagram that shows the frequencies of data as rectangular bars, each as tall as its frequency, is a bar diagram (स्तम्भ चित्र). One with a single bar for each item is a simple bar diagram.
When you draw one:
- Draw the X-axis (along the bottom, for the items) and the Y-axis (up the side, for the numbers) clearly, and name both.
- Give the diagram a title that says what it shows.
- Make all the bars the same width.
- Leave the same gap between every two bars.
- Choose a scale for the Y-axis that starts at 0 and goes up in equal steps, so the tallest bar fits.
On a bar diagram, 1 square up stands for 5 students, and a bar is 9 squares tall. How many students does it show?
Pick an answer to see why.
Why must all the bars in a bar diagram be the same width?
Pick an answer to see why.
Exercise 20.2
Question 1
Show the data in a simple bar diagram.
| Day | Sunday | Monday | Tuesday | Wednesday | Thursday | Friday |
|---|---|---|---|---|---|---|
| Absent students | 5 | 10 | 25 | 10 | 5 | 5 |
Answer
Question 2
Here are the marks Sankalpa got in his first terminal examination. Show them in a simple bar diagram.
| Subject | Nepali | Mathematics | English | Science and Technology | Social Studies and Human Value Education |
|---|---|---|---|---|---|
| Marks | 65 | 90 | 75 | 80 | 55 |
Hint
Answer
Question 3
The bar diagram shows the number of students in each grade, 6 to 12, of a school. Answer the questions.
Which grade has the most students?
Answer
Which grade has the fewest students?
Answer
How many students are there in Grade 8, and in Grade 11?
Answer
How many students are there in the school from Grade 6 to Grade 12 in all?
Answer
Make a frequency table from the bar diagram.
Answer
Question 4
Here are the animals on a farm. Show them in a simple bar diagram.
| Animal | Cow | Buffalo | Sheep | Goat | Pig |
|---|---|---|---|---|---|
| Number | 15 | 10 | 35 | 40 | 25 |
Answer
Miscellaneous Exercise
Question 1
39 students of Grade 6 were asked, “How many people are there in your family?” Here are their answers.
3, 3, 3, 3, 4, 4, 4, 4, 4, 4, 5, 5, 5, 5, 5, 5, 5, 6, 6, 6, 6, 6, 6, 6, 6, 7, 7, 7, 7, 7, 4, 5, 6, 7, 4, 5, 6, 3, 5
Show the data in a frequency table with tally marks. Then draw a simple bar diagram of it.
Answer
Question 2
The bar diagram shows the population, in lakhs, of a city over six years. Answer the questions.
In which year was the population largest?
Answer
What was the population in 2072?
Answer
In which year did the population grow the least, and by how much?
Hint
Answer
Make a frequency table from the bar diagram.
Answer
Question 3
The bar diagram shows a family’s spending in a year, in thousands of rupees. Answer the questions.
On which heading does the family spend the most?
Answer
How much does the family spend on education in a year?
Answer
On which headings does the family spend the same amount, and how much?
Answer
How much does the family spend in a year in all?
Answer
What percent of the family’s spending is on food?
Answer
Make a frequency table from the bar diagram.
Answer
Printable PDFs
- Study notes 1 page
- Harder practice questions 2 pages Answer key
Practice every question in the book, and keep track of the ones you miss →
Back to breakfast
Here is the board from the start, counted in one pass with tally marks:
The frequencies add up to 30, so no answer was missed. And as a simple bar diagram:
More students ate dal bhat than anything else: 9 of the 30. And 3 students came to school with only a cup of tea. The table gives the exact numbers; the diagram shows the answer at a glance. A class teacher who saw that bar might ask why those three had nothing to eat, which is what data are for: they turn a feeling into a number you can act on.
Where this is used
- The census. Nepal’s National Statistics Office (the Central Bureau of Statistics until October 2022) collects raw data from every household and publishes them as tables, from the whole country down to each of the 753 local bodies.
- Finding the biggest problem first. A bar diagram with its bars arranged from tallest to shortest (with a line added for the running total) is called a Pareto chart. In quality control, factories use one to see which kind of fault happens most often, and fix that first.
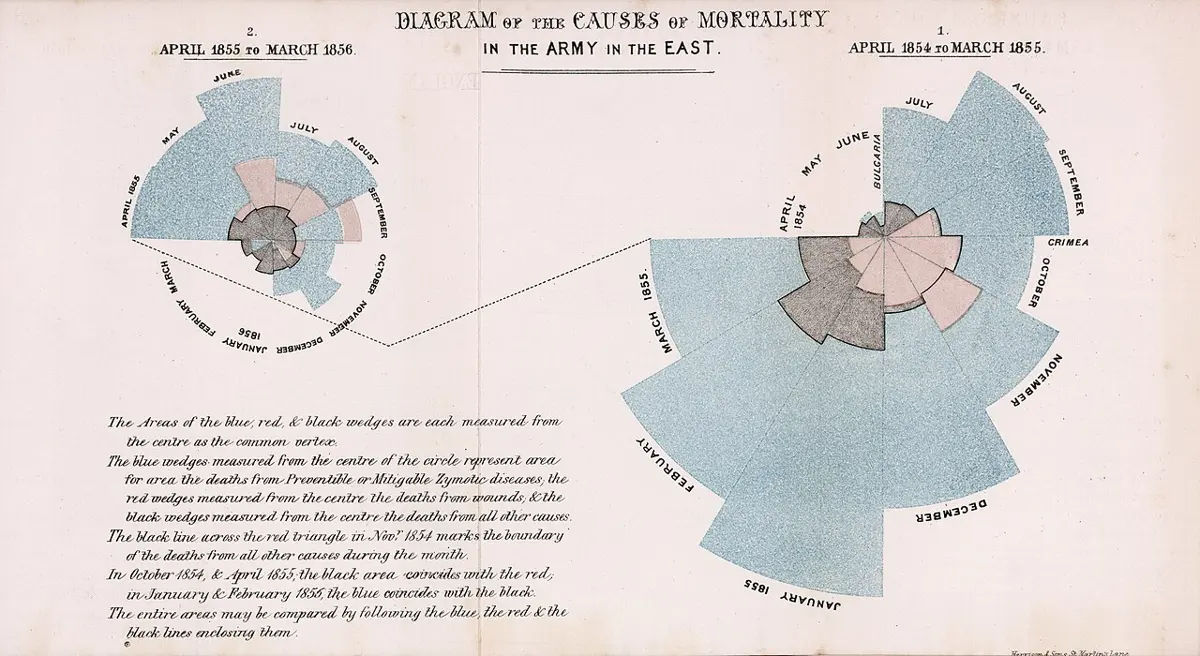
- Health. Florence Nightingale used diagrams of soldiers’ deaths to show officials, at a glance, that most of the deaths could be prevented.
Where these facts come from
- Nepal’s 2021 census: Wikipedia, “2021 Nepal census” (conducted by the Central Bureau of Statistics; enumerators went to every family; 7 provinces, 77 districts and 753 local bodies), read November 2026.
- Florence Nightingale: Wikipedia, “Florence Nightingale” (arrived at Scutari in November 1854; 4,077 deaths there in her first winter, ten times more from illness than from battle wounds; overcrowding, defective sewers, no ventilation; her diagrams for officials who would not read statistical reports; first female member of the Royal Statistical Society, 1859), read November 2026. Her diagram: Wikimedia Commons, “File:Nightingale-mortality.jpg” (published in Notes on Matters Affecting the Health, Efficiency, and Hospital Administration of the British Army and sent to Queen Victoria in 1858), read November 2026.
- The National Statistics Office: Wikipedia, “National Statistics Office (Nepal)” (the Central Bureau of Statistics, set up in 1959, became the National Statistics Office on 13 October 2022; it publishes Nepal’s censuses), read November 2026.
- Bar charts and Pareto charts: Wikipedia, “Bar chart” (bars proportional to their values; bars arranged from highest to lowest are Pareto charts) and “Pareto chart” (bars in descending order with a line for the running total; used in quality control to find the most frequent defects), read November 2026.
A companion to your textbook, not a replacement for it: study from the book your school uses, and where the two differ, follow your teacher. Found a mistake? Please tell us.