
Nepal’s 2021 census visited about 6.66 million households. It counted about 4.88 million with a mobile phone and about 4.86 million with a smartphone. Add the two and you get 9.74 million: more households than Nepal has. Households with both kinds were counted twice, once in each list.
So how many really have a phone? A news report said 26.8% have none: does that follow from the two numbers? By the end of section 1.1 you will be able to say, with a picture you met in Grade 9, the Venn diagram, and one idea: fill it from the middle outwards. The same idea answers every “tick all that apply” survey in this unit, and the sets question the SEE asks every year.
1.0 Review: sets and Venn diagrams
A set is a well-defined collection of things, called its elements or members. “Students of Grade 10 who like science” is a set: for any student, you can say whether they belong to it or not.
Here is what you need from Grade 9, in one place.
| Idea | In words | In symbols |
|---|---|---|
| Listing method | write the elements inside curly brackets | A = {1, 3, 5} |
| Cardinal number | how many elements a set has | n(A) = 3 |
| Universal set | the set of everything being talked about | U |
| Subset | every element of A is also in B | A ⊂ B |
| Union | elements in A or B or both | A ∪ B |
| Intersection | elements in both A and B | A ∩ B |
| Difference | elements in A but not in B (“A only”) | A − B |
| Complement | elements of U not in A | A |
Two sets are overlapping when they have some elements in common, and disjoint when they have none. The number of elements of a set, n(A), is also called the cardinality of the set. This unit is all about cardinality: we rarely list the elements, we count them.
In a Venn diagram, the universal set is a rectangle and each set is a circle inside it. Two overlapping circles cut the rectangle into four regions, and every element sits in exactly one of them.
The roll-number survey
Students with roll numbers 1 to 15 in Grade 10 were asked whether they like Mathematics and whether they like Science. Each student’s roll number is written in the region that fits their answers, in Figure 1.1.
Notice something in the answers. n(M) + n(S) = 8 + 8 = 16, but only 5 + 3 + 5 = 13 students like at least one subject. The 3 students in the middle were counted in M and in S. That double count is the heart of this unit.
In Figure 1.1, which set is M ∩ S?
Pick an answer to see why.
1.1 Cardinality of two sets
Activity 1: coffee or tea
Let C be the set of students who like coffee and T the set who like tea. Fill the diagram in this order.
- The middle first. 6 students like both, so write 6 where the circles overlap: n(C ∩ T) = 6.
- Then each circle’s other part. The coffee circle holds 15 students in all, and 6 of them are already written in the middle. So the part of C outside T holds 15 − 6 = 9. In the same way, tea only is 10 − 6 = 4.
- Then outside the circles. 5 like neither.
- Add the four regions for the whole class: 9 + 6 + 4 + 5 = 24 students.
Why the middle first? Because “15 like coffee” includes the 6 who like both. If you wrote 15 in the coffee-only part, the 6 would be counted twice. Starting from the middle means every number you write is a part no other number overlaps.
Names for the four regions
Every two-set question is about these four regions, so learn their names.
| Region | In words | In symbols |
|---|---|---|
| inside A only | A only | n₀(A) = n(A − B) |
| the overlap | both A and B | n(A ∩ B) |
| inside B only | B only | n₀(B) = n(B − A) |
| outside both | neither A nor B | n(A ∪ B) |
The small zero in n₀(A) means “only”. Both ways of writing it are used in exams; write either.
The formulas, and why they work
If A and B are overlapping sets:
When you add n(A) and n(B), the elements in the overlap are counted twice, once in each circle. Subtracting n(A ∩ B) once leaves every element counted exactly once. In the coffee survey: n(C ∪ T) = 15 + 10 − 6 = 19, which is 9 + 6 + 4.
The rest follow from the picture:
- If A and B are disjoint, there is no overlap, so n(A ∪ B) = n(A) + n(B).
- If every element of U is in A or B, then n(U) = n(A ∪ B).
- If some elements are in neither, then n(U) = n(A ∪ B) + n(A ∪ B).
The words exam questions use
| The question says | It means | Count |
|---|---|---|
| at least one (either, one or both) | A or B or both | n(A ∪ B) = n(A) + n(B) − n(A ∩ B) |
| both | the overlap | n(A ∩ B) |
| exactly one, only one | one of them but not both | n₀(A) + n₀(B) = n(A) + n(B) − 2 n(A ∩ B) |
| at most one (not both) | everyone except the overlap | n(U) − n(A ∩ B) |
| neither, none | outside both circles | n(A ∪ B) = n(U) − n(A ∪ B) |
Why −2 n(A ∩ B) for “exactly one”? Adding n(A) and n(B) counts the overlap twice, and “exactly one” wants it zero times, so it is taken away twice.
In a group, n(A) = 12 and n(B) = 8. What is the least possible value of n(A ∪ B)?
Pick an answer to see why.
In a class, 18 students play football, 14 play cricket and 5 play both. How many play exactly one of the two games?
Pick an answer to see why.
Practice the method on the screen first: the widget asks for one region at a time, in the right order.
Worked examples
In each one, read the question, try it yourself, then open the solution one step at a time. A full answer has three parts: say what each letter stands for, draw the Venn diagram, then calculate with a sentence at the end.
There is a quicker way to see part b: everything in percentages. At least one subject is 100% − 5% = 95%. Both is 75% + 55% − 95% = 35%. So 35% of the students are 21 students, and 1% is 21 ÷ 35 = 0.6: the total is 0.6 × 100 = 60.
Back to the census
What we can say for sure: at least 4.88 million households, nearly three in four, have a phone, and at most 1.78 million (26.8%) have none. The two numbers alone can’t say more. Here is why.
Let M be the households with a mobile phone and S the households with a smartphone, in millions: n(U) = 6.66, n(M) = 4.88, n(S) = 4.86. The formula says
and the census table doesn’t give the overlap. But the overlap can’t be just anything:
- The union can’t be bigger than all the households: 9.74 − n(M ∩ S) ≤ 6.66, so n(M ∩ S) ≥ 3.08. At least 3.08 million households were counted in both lists.
- The overlap can’t be bigger than the smaller set: n(M ∩ S) ≤ 4.86. Then n(M ∪ S) = 4.88, every smartphone household is also in M, and S ⊂ M.
So between 4.88 and 6.66 million households have a phone. Slide the overlap and watch.
So the news report’s 26.8% is right only if S ⊂ M: if the census’s “mobile phone” includes smartphones. If it means the ordinary kind only, a household with just a smartphone is outside M but still has a phone, and the share with none could be anything from 26.8% down to 0%. Which reading is right is a question of what the census asked, not of maths. That is the real lesson: before you add two counts, ask what is in each set and how they overlap.
Exercise 1.1
Question 1
Give examples of the cardinality of sets, and show them to your teacher.
Answer
For two sets A and B with A ⊂ B, find n(A ∪ B) and n(A ∩ B).
Answer
If A and B are overlapping sets, write the formula for n(A ∪ B).
Answer
The sets A and B have 12 and 8 elements. Find the least possible number of elements in A ∪ B.
Answer
Question 2
In Figure 1.8, 80 people are in set M, 90 are in set E and 15 are in neither. Find:
- a.n₀(M)
- b.n₀(E)
- c.n(M)
- d.n(E)
- e.n(M ∪ E)
- f.n(M ∩ E)
- g.n(M ∪ E)
- h.n(U)
Answer
Question 3
If n(U) = 200, n₀(M) = 2x, n₀(E) = 3x, n(M ∩ E) = 60 and n(M ∪ E) = 40, find x.
Answer
If n(U) = 350, n(A) = 200, n(B) = 220 and n(A ∩ B) = 120, find n(A ∪ B) and n(A ∪ B).
Answer
If n(A) = 35 and n(A) = 25, find n(U).
Answer
Of two sets P and Q, P has 40 elements, P ∪ Q has 60 and P ∩ Q has 10. How many elements has Q?
Answer
Question 4
In a survey of 180 students of a school, 45 like Nepali only and 60 like English only, but 15 like neither subject.
- i.Show the information in a Venn diagram.
- ii.Find the number of students who like both subjects.
- iii.Find the number who like at least one subject.
Answer
In a survey of 1,200 students of a school, 100 like Mathematics only and 200 like Science only, but 700 like neither.
- i.Show the information in a Venn diagram.
- ii.Find the number who like both subjects.
- iii.Find the number who like at least one subject.
Answer
In a survey of 60 students, 10 play football only and 20 play volleyball only, but 12 play neither game.
- i.Show the information in a Venn diagram.
- ii.Find the number who play both games.
- iii.Find the number who play at least one game.
Answer
Question 5
A survey of 900 people of a community found that 525 read Madhupark, 450 read Yuba Manch, and 75 read neither magazine.
- i.Show the information in a Venn diagram.
- ii.Find the number who read both.
- iii.Find the number who read only one.
Answer
In a survey of 150 people, 90 like modern songs and 70 like folk songs, but 30 like neither.
- i.Show the information in a Venn diagram.
- ii.Find the number who like both kinds of song.
- iii.Find the number who like only modern songs.
Answer
In a survey of 360 players, 210 liked to play volleyball and 180 liked football, but 30 liked neither.
- i.Show the information in a Venn diagram.
- ii.Find the number who like both games.
- iii.Find the number who like only one game.
Answer
Question 6
Of the students who sat an examination, 70% passed English and 60% passed Mathematics, 20% failed both, and 550 students passed both.
- i.Show the information in a Venn diagram.
- ii.Find the total number of students who sat the examination.
- iii.Find how many passed English only.
Answer
In a survey of students who sat the Grade 10 examination, 60% wanted to study Science and 70% Management, while 10% wanted neither. 400 students wanted to study both.
- i.Show the information in a Venn diagram.
- ii.Find how many students took part in the survey.
- iii.Find the number who wanted to study Science only.
Answer
In a survey of the people of a community, 65% ride a motorcycle and 35% ride a scooter, while 20% ride both. 200 people ride both.
- i.Show the information in a Venn diagram.
- ii.Find how many people took part in the survey.
- iii.Find the number who ride motorcycles only.
Answer
Question 7
Among 95 people of a community, the numbers who drink tea and coffee are in the ratio 4 : 5. 10 people drink both, and 15 drink neither.
- i.Show the information in a Venn diagram.
- ii.Find the number who drink exactly one of tea or coffee.
- iii.Find the number who drink at least one.
Answer
In a class of 64 students, each likes milk or curd or both. The numbers who like only milk and only curd are in the ratio 2 : 1, and 16 like both.
- i.Show the information in a Venn diagram.
- ii.Find the number who like milk.
- iii.Find the number who like only one.
Answer
At a conference of 320 participants, 60 only sing and 100 only dance. The number who do neither is three times the number who do both.
- i.Show the information in a Venn diagram.
- ii.Find how many do neither.
- iii.Find the number who do at most one of the two.
Answer
Questions 8 to 11
In a survey of 200 people of a community, the numbers who use only a laptop and only a mobile were in the ratio 2 : 3. 30% use both and 15% use neither.
- i.Show the information in a Venn diagram.
- ii.Find the number who use a laptop.
- iii.Find how many use at most one of the two.
Answer
In a survey of 300 players, one-third play volleyball only. 60% of the rest play football only, and 60 play neither. Using a Venn diagram, find the ratio of the number who play volleyball to the number who play football.
Answer
Of 65 players in a survey, 11 play volleyball only and 33 play cricket only. The number who play cricket is twice the number who play volleyball. Using a Venn diagram, find the number who play both and the number who play neither.
Answer
In a survey of 80 people, 60 like only oranges and 10 like both oranges and apples. The number who like oranges is 5 times the number who like apples. Using a Venn diagram, find the number who like apples only and the number who like neither fruit.
Answer
1.2 Cardinality of three sets
With three sets, three circles overlap, and the rectangle is cut into eight regions: one for each set alone, one for each pair, one in the very middle for all three, and one outside all the circles.
You already know a three-set Venn diagram, though you may not have seen it drawn. Your blood type says which of three markers (antigens) sit on your red blood cells: A, B and RhD. Group A has the A marker, group B the B marker, AB both and O neither; “positive” means the RhD marker is there and “negative” that it isn’t. Three markers, each there or not: that is 2 × 2 × 2 = 8 blood types, one for each region.
Activity 2: two diagrams
Activity 3: filling three circles
The rule is the same as for two sets: the middle first, then outwards.
- The very middle: 5 like all three.
- The pairs: 15 like oranges and mangoes, but that 15 includes the 5 who like all three. So oranges and mangoes only is 15 − 5 = 10. In the same way, mangoes and bananas only is 20 − 5 = 15, and oranges and bananas only is 25 − 5 = 20.
- Each fruit alone: the orange circle holds 40, and 5 + 10 + 20 = 35 of them are already written. Oranges only: 40 − 35 = 5. Mangoes only: 35 − (5 + 10 + 15) = 5. Bananas only: 50 − (5 + 15 + 20) = 10.
- Outside: 30.
- Add all eight regions: 5 + 5 + 10 + 10 + 15 + 20 + 5 + 30 = 100 students.
The relations
If A, B and C are overlapping sets, the picture gives these relations. The “only” regions of each pair:
Each whole circle is four regions:
The union is the seven regions inside the circles, and the universal set adds the outside:
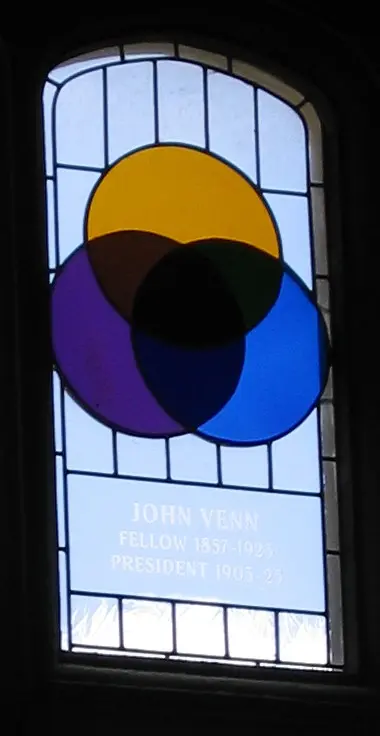
The formula for three sets
Most questions give the whole sets and the pairs, not the regions. For those there is one formula:
Why does it end with a plus? Count how many times the very middle is counted. Adding the three sets counts it 3 times. Taking away the three pairs takes it away 3 times, leaving 0. So it has to be added back once. Try it on the screen.
The formula can also be proved from the two-set formula, by treating A ∪ B as one set:
The second line uses the two-set formula for A ∪ B and C. The third uses it again, and the distributive law (A ∪ B) ∩ C = (A ∩ C) ∪ (B ∩ C). The fourth uses the two-set formula once more, since (A ∩ C) ∩ (B ∩ C) = A ∩ B ∩ C.
If the three sets are disjoint (no two overlap), every overlap is 0 and n(A ∪ B ∪ C) = n(A) + n(B) + n(C).
In a three-set Venn diagram, n(A ∩ B) = 12 and n(A ∩ B ∩ C) = 5. What is n₀(A ∩ B)?
Pick an answer to see why.
Worked examples
You can also solve Example 2 straight from the diagram: call the middle x, write every other region in terms of x (Science and Mathematics only is 26 − x, Science only is 86 − (26 − x) − x − (32 − x) = 28 + x, and so on), and add all eight regions to get 168 + x = 180. It is longer, but it is the method to use when the formula doesn’t fit the question.
Exercise 1.2
Question 1
Figure 1.32 shows the elements of the sets P, Q and R. Find:
- a.n(P)
- b.n(Q)
- c.n(P ∪ Q ∪ R)
- d.n₀(P)
- e.n₀(R)
- f.n(P ∩ R)
- g.n(P ∪ Q ∪ R)
- h.n₀(P ∩ Q)
- i.n(P ∩ Q ∩ R)
Answer
Question 2
If U = {positive integers less than 30}, P = {multiples of 2 less than 30}, Q = {multiples of 3 less than 30} and R = {multiples of 5 less than 30}, show the sets in a Venn diagram and verify:
- a.n(P ∪ Q) = n(P) + n(Q) − n(P ∩ Q)
- b.n(P ∪ Q ∪ R) = n(P) + n(Q) + n(R) − n(P ∩ Q) − n(Q ∩ R) − n(R ∩ P) + n(P ∩ Q ∩ R)
- c.n(P ∪ Q ∪ R) = n(P − Q) + n(Q − R) + n(R − P) + n(P ∩ Q ∩ R)
Answer
Question 3
If n(U) = 100, n(M) = 45, n(E) = 50, n(S) = 35, n(M ∩ E) = 20, n(E ∩ S) = 20, n(S ∩ M) = 15 and n(M ∩ E ∩ S) = 5, find n(M ∪ E ∪ S).
Answer
If n(U) = 105, n(A) = 40, n(B) = 35, n(C) = 30, n(A ∩ B) = 15, n(B ∩ C) = 12, n(A ∩ B ∩ C) = 6 and n(A ∪ B ∪ C) = 30, find n(A ∩ C).
Answer
If n(U) = 120, n(M) = 50, n(E) = 40, n(S) = 45, n(M ∩ E) = 15, n(E ∩ S) = 15, n(S ∩ M) = 15 and n(M ∪ E ∪ S) = 15, find n(M ∩ E ∩ S).
Answer
If n(A ∪ B ∪ C) = 105, n₀(A) = 25, n₀(B) = 25, n₀(C) = 15, n₀(A ∩ B) = 15, n₀(A ∩ C) = 10 and n(A ∩ B ∩ C) = 10, find n₀(B ∩ C).
Answer
Question 4
Of 90 students who sat an examination, 43 passed Science, 40 Mathematics and 38 Nepali. 13 passed Science and Mathematics, 18 Mathematics and Nepali, and 16 Science and Nepali; 6 passed all three.
- i.Show the information in a Venn diagram.
- ii.Find the number who passed none of the subjects.
Answer
In a survey of a group, 60 like tea, 45 coffee and 30 milk; 25 like coffee and tea, 20 milk and tea, 15 coffee and milk, and 10 like all three. Everyone surveyed likes at least one of them.
- i.Show the information in a Venn diagram.
- ii.Find how many people were surveyed.
Answer
In a survey of 60 students, 23 played volleyball, 15 basketball and 20 cricket. 7 played volleyball and basketball, 5 basketball and cricket, and 4 volleyball and cricket, while 15 played none of the games.
- i.Show the information in a Venn diagram.
- ii.Find how many played all three games.
- iii.How many played volleyball and cricket only?
Answer
Question 5
Of the students who sat an examination, 40% passed Science, 45% Mathematics and 50% Nepali. 10% passed Science and Mathematics, 20% Mathematics and Nepali, and 15% Science and Nepali, while 5% failed all three.
- i.Find the percentage who passed all three subjects.
- ii.Find the percentage who passed only one subject.
- iii.Find the percentage who passed exactly two subjects.
- iv.Find the percentage who passed at least one subject.
- v.Show the information in a Venn diagram.
Answer
Question 6
A survey asked some people of a community whether they read Yuba Manch, Madhupark or Muna. 30 read Yuba Manch and 25 Madhupark; 15 read both Yuba Manch and Muna, and 12 both Yuba Manch and Madhupark. 9 read Madhupark only, 11 Muna only, 5 Yuba Manch and Madhupark only, and 10 read none of them.
- a.Show the information in a Venn diagram.
- b.Find the total number of people surveyed.
- c.Find the number who read exactly two magazines.
- d.Find the number who read Muna.
Hint
Answer
Question 7
90 people were asked which films they like by language: 48 like Nepali films, 40 English and 31 Hindi; 24 like Nepali and English, 19 Hindi and English, and 6 like all three. 21 like none of them.
- a.How many like both Nepali and Hindi films?
- b.How many do not like Hindi films?
- c.How many like neither Nepali nor Hindi films?
Answer
How the SEE asks it
In the SEE’s Compulsory Mathematics paper, Sets is always one question of 6 marks, with four parts at four levels (CDC’s specification grid):
| Part | Level | Marks | What it asks |
|---|---|---|---|
| a. | knowledge | 1 | write something in cardinality notation, or a formula |
| b. | understanding | 1 | show the information in a Venn diagram |
| c. | application | 3 | calculate a region, the total, or an unknown |
| d. | higher ability | 1 | a twist: a ratio, a percentage, or “what if…” |
The question is a survey of two or three sets, with Nepali places, subjects or games (CDC’s own model question has three). Here is one of each, with how they are marked.
Mixed exercise
Two overlapping sets A and B have n₀(A) = 16 + x, n₀(B) = 5x, n(A ∩ B) = y and n(A ∪ B) = x.
- a.Show the information in a Venn diagram.
- b.If n(A) = n(B), find n(A ∪ B).
- c.If also n(U) = 50, find the ratio of n(A ∩ B) to n(A ∪ B).
Answer
A and B are subsets of the universal set U, with n(U) = 100, n(A − B) = 32 + x, n(B − A) = 5x, n(A ∩ B) = x and n(A ∪ B) = y.
- a.Show the information in a Venn diagram.
- b.If n(A) = n(B), find n(A ∩ B).
- c.Find n(A ∪ B).
- d.By what percentage is n(A ∪ B) more or less than n(A ∩ B)?
Answer
In a survey of 93 women of a community, 80 work in farming and 71 in sewing, while 10 do other work.
- a.Find the cardinality of each region and show it in a Venn diagram.
- b.Find how many women do both.
- c.How many times the number who only farm is the number who only sew?
Answer
In a survey of 1,000 farmers in a community, 800 grew potatoes and 500 tomatoes, while 50 grew other crops only.
- a.Find the cardinality of each region and show it in a Venn diagram.
- b.Find the number who grow both.
- c.Write the numbers who grow only potatoes and only tomatoes as a ratio.
Answer
In a survey of 400 people of a community, the numbers with only a motorcycle license and only a car license were in the ratio 5 : 3. One-fourth of the people had both licenses, and 60 had none.
- a.Show the information in a Venn diagram.
- b.How many people had each license?
- c.Find the number who had only a motorcycle license.
Answer
In a school, 100 students like football, 80 volleyball and 120 cricket. 30 like football and volleyball, 20 volleyball and cricket, and 35 football and cricket. 10 like all three games, and 5 like none of them.
- a.Write the information in cardinality notation.
- b.Show it in a Venn diagram.
- c.Find the total number of students in the school.
- d.What percentage of the students like football only?
Answer
A survey of 45 people of a community: 25 speak Nepal Bhasa, 23 Tamang and 15 Maithili. 12 speak Nepal Bhasa and Tamang, 5 Nepal Bhasa and Maithili, and 10 Tamang and Maithili; 4 speak all three.
- a.Show the information in a Venn diagram.
- b.How many speak none of these three languages?
- c.How many speak only one of them?
- d.How many speak both Nepal Bhasa and Tamang but not Maithili?
Answer
Practice every question in the book, and keep track of the ones you miss →
Where these facts come from
- The census’s household and phone counts, and the 26.8% with no phone (the opening): the 2021 census, as tabulated by Nepali Telecom, “National Census 2078: internet and phone access in Nepal”, March 2023.
- The minus sign in a Google search and the example jaguar speed -car (1.0): Google Search Help, “Refine Google searches”, read October 2026.
- Google Photos’ face groups and the Filter that shows the photos with both people (1.1): Google Photos Help, “Set up & manage your face groups”, section “Filter a face group”, read October 2026.
- Blood groups, antibodies, the universal donor and recipient, and cross-matching (1.2): Wikipedia, “Blood type”, sections on the ABO and Rh systems and on universal donors and recipients, read October 2026.
A companion to your textbook, not a replacement for it: study from the book your school uses, and where the two differ, follow your teacher. Found a mistake? Please tell us.