
Think of the last thing you learned from your phone. Perhaps a video of a teacher solving a sum, with her voice explaining each step, the numbers written on the screen, and an arrow sliding across to show where the 7 goes. Or a map that turned into a 3D picture of the mountains around Pokhara when you tilted it. None of that is one kind of thing: it is words, pictures, sound, moving film and animation, joined together so that each does the job it does best.
That joining is called multimedia. In this unit you find out how a computer stores each of these as numbers, why a photo is saved one way and a logo another, what the wiggly line in a sound editor means, and why a video can be smooth or jerky, sharp or blurry. Then you make some yourself: a poster in a graphics editor, a recording in an audio editor, and a short video, the way professionals do, step by step.
Introduction: what multimedia is
Imagine you are using an educational app on your phone to study. It shows animated science experiments, explains each one in a teacher’s voice, gives you practice quizzes, and has video lessons by teachers from all over Nepal. Text, pictures, sound, video and animation are all put together in one place. That app is multimedia, and the tools and methods used to make it are multimedia technology.
The word is made of two parts: multi, meaning many, and media, the different forms in which information can be given (the plural of medium). So:
- Multimedia is information presented using more than one kind of media together: text, graphics, audio, video and animation.
- Multimedia technology is the hardware and software used to create, edit, store and play multimedia: cameras and microphones, editing programs, file formats, and the screens and speakers that show the result. Films, games and websites are all made with it.
You use multimedia apps every day:
- Duolingo teaches languages with words, a voice to copy, sound effects and little animations that celebrate a right answer.
- TikTok mixes short videos with filters, text on the screen and music.
- YouTube combines videos, sound, thumbnails (the small picture you see before pressing play) and live chat, for learning as well as fun.
- Google Earth joins satellite photos, text labels and 3D maps that you can fly through.
In Nepal, OLE Nepal’s E-Paath puts school lessons for the lower grades into interactive activities, with pictures, sound and animation, that students in government schools use on laptops and phones.
The five components of multimedia
Every piece of multimedia is made from five kinds of media, its components:
- a.Text: letters, numbers and symbols, such as headings, labels and captions.
- b.Graphics: still pictures, such as photos, drawings, charts, logos and icons.
- c.Audio: sound, such as speech, music and sound effects.
- d.Video: moving pictures filmed with a camera, usually with their sound.
- e.Animation: pictures that are made (drawn or modeled), not filmed, and shown one after another so that they seem to move.
What does the word “multimedia” mean?
Pick an answer to see why.
A cartoon character waves at you on a website. Which component of multimedia is it?
Pick an answer to see why.
Applications of multimedia
Multimedia is used wherever people want to explain, entertain, sell or keep in touch. Its main uses (its applications):
- a.Education. E-books, online courses, learning apps and simulations (programs that copy how something real behaves, such as a circuit or a planet’s orbit) use multimedia, because seeing, hearing and trying things helps learners understand and remember. The interactive parts of this book are multimedia too.
- b.Entertainment. Films, music, video games and virtual reality (a computer-made world you seem to stand inside, seen through a headset) are all multimedia. It has changed entertainment from something we only watch into something we can take part in.
- c.Business. Advertisements on TV, on billboards and on phones use pictures, music and video to catch people’s attention, so that they remember the product. That makes marketing more effective. Businesses also use multimedia for presentations, training and showing products online.
- d.Communication. Video calls, voice messages and social media use multimedia, so that we can see and hear family, friends and colleagues, even when they are working abroad.
- e.Content creation. People who make videos, posters, podcasts and posts for social media depend on multimedia tools. Videos, graphics, animations and sound effects help them get their message across clearly and creatively, so more people see it.
Multimedia is used in many other places too: doctors study 3D scans, engineers test designs as animations, and news websites mix articles, photos, maps and videos.
Advantages and drawbacks of multimedia
Multimedia isn’t always the best choice. It has strengths and costs:
| Advantages | Drawbacks |
|---|---|
| It catches and holds attention better than text alone. | The hardware and software to make it (cameras, microphones, editing programs, powerful computers) can be costly, and not everyone can get them. |
| It makes ideas easier to understand and remember: a diagram or a video shows what words struggle to say. | Its files are large: they need a lot of storage, and fast, cheap internet to send and watch them, which many places don’t have. |
| It reaches people who can’t read well, or who learn better by seeing and hearing. | It takes time and skill to make well. |
| It can be interactive: the user chooses, tries and gets feedback. | Too many sounds, colors and movements can distract people from the message. |
| One file can be shared with thousands of people at almost no cost. | It is easy to copy other people’s work without permission, breaking copyright. |
Which of these is a drawback of multimedia?
Pick an answer to see why.
3.1 Text
Text is the letters, numbers and symbols you read on a screen. Because it is made of letters (alphabets) and numbers, it is also called alphanumeric data. Put together, these characters give meaningful information to the reader: a heading, a label on a diagram, the captions under a video.
You type and edit text in a text editor or a word processor. Common ones are Notepad (plain text only), WordPad (which can add simple styles) and Microsoft Word (a full word processor).
A computer keeps each character as a number, its code. In Unicode, the code shared by every modern computer and phone, “A” is 65 and “क” is 2325 (Grade 7, Text is numbers). So text takes very little space: a whole page of a book is only a few thousand bytes, less than one small photo.
Text is a part of multimedia because it can be presented in many ways: in different fonts (designs of letters), sizes, styles (bold, italic, underlined) and colors, moving onto the screen, or placed on a photo or a video. In multimedia, text usually does the jobs that need to be exact: names, numbers, headings, instructions and captions.
3.1.1 Text file formats
A file format is the way a file’s contents are arranged in bytes, so that a program knows how to read it. Its file extension, the letters after the dot in its name (notes.txt), tells you which format it is. Three common formats for text:
- a.TXT (plain text) stores only the characters themselves: no fonts, sizes or colors. It is the simplest text format, and every computer and phone can open it.
- b.RTF (Rich Text Format) stores text together with its style: font, size, color, bold and italic, line spacing, indentation and so on. It was made by Microsoft in 1987 so that documents could move between different word processors, and almost all of them can still open it.
- c.DOCX is the native format of Microsoft Word (since Word 2007). Like RTF, it stores text with its styles, and also pictures, tables, page layouts, comments and much more.
Here is the same short note saved three ways. A TXT file holds only the characters:
notice.txt
Science Fair on Friday.An RTF file is also text, but with control words, starting with a backslash, that describe the style. Open one in Notepad and you see them:
notice.rtf
{\rtf1\ansi{\fonttbl{\f0\fswiss Arial;}}\f0\fs28 Science Fair on {\b Friday}.\par}\fs28 sets the font size in half-points (28 half-points is 14 points), and {\b Friday} makes that one word bold. A word processor reads these and shows the note in Arial, with “Friday” in bold. A DOCX file isn’t readable in Notepad at all: it is a ZIP file, a compressed folder, holding several files written in XML, a text language of tags.
| TXT | RTF | DOCX | |
|---|---|---|---|
| What it stores | characters only | characters and their styles | characters, styles, pictures, tables, layout |
| Readable in Notepad? | yes | yes, with control words | no (it is a ZIP) |
| File size | smallest | larger | larger, but compressed |
| Opened by | everything | almost every word processor | Word and most modern word processors |
| Good for | notes, code, data | sharing styled text between programs | documents and reports |
Which file format stores only text, with no styles at all?
Pick an answer to see why.
Which term describes the characters we see on a screen, also called alphanumeric data?
Pick an answer to see why.
3.2 Graphics
Graphics are the visual elements we see on a screen: photos, drawings, shapes, charts, icons and logos. Shapes in different colors, put together, give us information by sight. A map, a road sign or a pie chart tells you something in a second that would take a paragraph to write.
You make and change graphics in a graphics editor. Common ones are Pixlr (free, in a web browser), Adobe Photoshop (for photos) and Adobe Illustrator (for drawings and logos). With them you can draw and edit shapes, add effects and change photos as you like.
3.2.1 Raster and vector graphics
A computer can keep a picture in two quite different ways: as a grid of colored dots, or as a list of shapes. These are the two types of computer graphics, raster and vector.
Raster graphics
Raster graphics, also called bitmap graphics, are made of pixels. A pixel (short for picture element) is the smallest part of a picture that a screen can show: one tiny square of a single color. A raster picture is a grid of pixels, and the file stores the color of every one of them, row by row.
Look closely at your phone’s screen with a magnifying glass, or a drop of water on it: you will see the tiny dots. A photo of 4,000 × 3,000 pixels has 12 million of them, each with its own color. Together they make a detailed picture. So the more pixels a picture has, the more detail it can show. The number of pixels across and down is the picture’s resolution, such as 1,920 × 1,080.
Raster graphics are best for photos and paintings, where every pixel can be a slightly different color. Their weakness shows when you enlarge them: the computer has no more detail to show, so it just makes each pixel bigger, and the picture turns blocky (pixelated) or blurred.
The most common raster file formats are:
- PNG (Portable Network Graphics) keeps every pixel exactly (it is lossless) and supports transparency: parts of the picture can be see-through, so a logo can sit on any background without a white box round it. Best for logos as pixels, screenshots, diagrams and anything with text.
- GIF (Graphics Interchange Format) is an old format, from 1987, that can hold only 256 different colors. It can store several pictures in one file and play them one after another, so it is used for short, looping animations on websites and in messages.
- JPG or JPEG (both the same format; Joint Photographic Experts Group, the committee that made it) is the most common format for photos. It compresses photos very well: it throws away fine detail the eye hardly notices (it is lossy), so photos of high quality fit in small files.
Vector graphics
Vector graphics are made of shapes: lines, curves, circles and polygons, each described by numbers, its mathematical formula. Instead of “this pixel is red, the next is red…”, a vector file says “a red circle, center here, radius this, outlined in black”.
The curves in vector graphics are usually Bézier curves. A Bézier curve is described by a few points: where it starts, where it ends, and one or two control points that pull the curve towards them, like a magnet bending a wire. Drawing programs show the control points as handles: drag one, and the curve bends smoothly.
Because a vector picture is a description, the computer draws it again from that description at whatever size it is shown. A logo stays perfectly sharp on a tiny ID card and on a banner across the school gate. And because a few numbers describe a whole shape, the files of simple drawings are small. Vector graphics are best for logos, icons, fonts, diagrams and maps, which are made of shapes with flat colors. They can’t store a photo, which has no shapes to describe, only millions of pixels.
The most common vector format is SVG (Scalable Vector Graphics), which most browsers, phones and graphics programs open. An SVG file is text you can read:
badge.svg
<svg xmlns="http://www.w3.org/2000/svg" viewBox="0 0 100 100"> <circle cx="50" cy="50" r="40" fill="gold" stroke="black"/> <path d="M20 70 C35 20, 65 20, 80 70" stroke="green" fill="none"/></svg>It says: a gold circle, outlined in black, with its center at (50, 50) and a radius of 40; then a green path from (20, 70) to (80, 70), bent by the control points (35, 20) and (65, 20). The C means a cubic Bézier curve. Every drawing in this book, the one above included, is SVG.
| Raster graphics | Vector graphics | |
|---|---|---|
| Made of | pixels, a grid of colored squares | shapes (lines, curves, circles) described by mathematical formulas |
| Enlarged | becomes blocky or blurred | stays sharp at any size |
| Best for | photos and paintings, with fine changes of color | logos, icons, fonts, diagrams, maps |
| File size depends on | the number of pixels | the number of shapes |
| Edited with | Photoshop, GIMP, Pixlr | Illustrator, Inkscape, CorelDRAW |
| Common formats | PNG, GIF, JPG | SVG (also PDF, AI, EPS) |
What type of graphics is made of Bézier curves and keeps its quality at any size?
Pick an answer to see why.
A photo of 800 × 600 pixels is enlarged to fill a big classroom screen. What happens?
Pick an answer to see why.
3.2.2 PDF: pages of text and graphics
PDF (Portable Document Format) stores whole pages: text, raster pictures and vector drawings together, with the fonts it uses packed inside. So it can hold raster graphics, vector graphics or both, depending on what was put into it and which program saved it. A scanned page is a raster picture inside a PDF; a page made in a word processor keeps its text and drawings as vectors, sharp at any zoom.
A PDF looks exactly the same on every computer, phone and printer, which is why it is the format for sharing documents online: forms, results, certificates, books and notices. It can also be used to store and share images and graphics. PDF was created by the company Adobe in 1993, and since 2008 it has been an open international standard (ISO 32000), so anyone may make programs that read and write it.
Which file format is commonly used for sharing documents online and can contain both raster and vector graphics?
Pick an answer to see why.
3.2.3 Graphics editing
To start editing graphics, you can use Pixlr, a free graphics editor that works in a web browser. Its simpler editor is called Pixlr Express (earlier Pixlr X), and there is a phone app too. You can crop, resize, rotate, adjust colors, add filters, and much more. The steps below follow Pixlr, but every graphics editor (Photoshop, GIMP, Canva, the editor in your phone’s gallery) works in much the same way, with the same ideas and similar names.
Before you start, learn the four main areas of the screen:
- Canvas area: the workspace in the middle, where you see and edit your picture.
- Tools panel: the strip of tools on the left side (text, shapes, cutout, crop, filters…).
- Layers panel: on the right, where you manage the picture’s layers (its photos, shapes and text).
- Navigation tools: at the bottom, to zoom in and out, move around (pan) and rotate the view.
Creating a new project
A project is the picture you are working on, with all its layers. To start one:
- Go to the Pixlr website (pixlr.com) and choose Pixlr Express.
- A page opens where you can open an existing image or create a new one.
- To start with a blank canvas, choose Create new. A dialog box appears.
- Choose a canvas size from the presets (ready-made sizes, such as a poster or a social media post), or type your own width and height in pixels. For example, name the project “Class 10 Project” and make it 1920 × 1080 pixels, the shape of a wide screen.
- Click the Create button at the bottom right.
- Your project is made, and you can start creating and editing.
Working with text
- In your new project, find the Text tool on the left of the screen. Its icon is a capital “T”.
- Click Add new text. A text box with sample words appears on the canvas.
- Type your own words in the box, or paste text copied from somewhere else.
- With the text selected, use the options on the left to change its font, size, style, color, alignment and spacing.
- To make the text bigger or smaller, drag the handles (the small squares on the box’s corners and edges). To move it, drag the text, or press the arrow keys while it is selected.
- To rotate the text, drag the round handle above the box.
- To change the text later, click its layer in the Layers panel on the right. From there you can also hide, lock, duplicate or delete it.
Working with shapes
- Click the Arrange tool (or Element) on the left sidebar. It offers three options: choose Shape.
- A shape appears on the canvas: a square at first.
- In the Type section, choose the shape you want instead, such as a circle.
- Use the options on the left to change its fill color (the inside), its outline color and its shadow.
- Drag the small square handles at its corners to change its size, and the round handle at the top to rotate it.
Working with layers
A layer is like a clear plastic sheet with something on it: one sheet for the background, one for a photo, one for a shape, one for the title. Stacked up, they make the picture you see. A layer higher in the stack covers the ones below it, except where it is empty (transparent), where you see through to the next.
Layers let you change one part without spoiling the rest. Move the title, and the photo under it is untouched: nothing was painted over it. Hide the background, and everything else stays. That is why editors put each new text, shape or photo on a layer of its own.
To use layers in Pixlr:
- Find the Layers panel on the right of the screen.
- Click the + button to add a new layer.
- The Add layer dialog box opens. Choose what kind of layer to add: for example, a shape layer, an image layer or an empty layer.
- Click the three-dot button (⋯) on a layer to open its options.
- There you can give the layer a name, lock it (so it can’t be changed by mistake) or hide it.
- You can also change a layer’s opacity (how solid it is: 100% hides what is below, 50% lets half of it show through) and its blend mode (how its colors mix with the layers below; Multiply, for example, darkens them, as two inks printed on top of each other do).
- To change the order of the layers, drag a layer up or down in the Layers panel.
A poster’s title can’t be seen, even though its layer is switched on. What is the most likely reason?
Pick an answer to see why.
Inserting an image in a project
You can put a photo into a project you have already started:
- Click the Element icon (in the tools panel).
- Click Add media (or Add image) in the options that appear.
- Find the picture on your computer and click Open.
- The picture is placed in your project, on a new layer of its own, where you can move, resize and rotate it like a shape.
Using the cutout tool
The cutout tool cuts an object out of its background: a person out of a crowd, a mango off a plate, so it can go on a new background or poster.
- Open a picture in Pixlr and click the Cutout icon on the left side of the screen.
- Choose the Cutout option from the list.
- Choose the shape of the cutout, and the softness of its edges (soft edges blend in better than hard ones).
- Click and drag over the object you want to cut out. The tool guesses the object’s edges.
- Use Keep and Remove to fix the selection: Keep adds the area you brush over, Remove takes it away.
- The Draw cutout tool lets you add or remove parts by painting freely over them.
- The Lasso cutout tool lets you draw round the part you want, freehand, like a lasso round a cow.
Many editors can now cut out the main object by themselves, using AI. Check the edges anyway: hair, fingers and see-through things often come out wrong.
Exporting the project
When your picture is finished, export it: save it as an ordinary image file that anyone can open, share or print.
- Click the Save button at the bottom right.
- A window opens, where you choose the file name, the format and the quality.
- Choose the format that suits the job. Pixlr can save JPG (photos, for the web and print), PNG (keeps transparency and sharp edges), WEBP (a newer format for web pages, with smaller files) and PXZ (Pixlr’s own format, which keeps every layer, so you can open the project again and go on editing it).
- Set the quality slider. Higher quality keeps more detail but makes a bigger file; lower quality makes a smaller file but loses detail, and blocks and smudges appear.
- Click Save as to save the picture to your device.
- A window opens where you choose the folder, and the file is saved.
3.3 Audio
Audio is sound in multimedia: speech, music, the sound of instruments, and sound effects. Every sound is made by something vibrating: a guitar string, the skin of a madal, your vocal cords. The vibration pushes the air back and forth, and those pushes travel to your ear. A microphone turns them into an electrical signal that rises and falls in the same way, and a computer stores that signal as a digital file of numbers.
3.3.1 Audio waveform
Sound changes from moment to moment. To show how it changes, we draw a graph of it against time, called an audio waveform: time runs from left to right, and the height of the line shows how far the air (or the microphone) is pushed at each moment.
A waveform has two things to read:
- Amplitude is the height of the wave, from the middle line to a peak. It shows how loud the sound is: the bigger the vibration, the taller the wave, and the louder the sound.
- The width of one complete wave shows how quickly the sound vibrates. The time one wave takes is its period, and the number of waves in one second is its frequency, measured in hertz (Hz). Frequency decides the pitch: narrow, close-together waves are a high sound (a whistle), wide ones a low sound (a drum).
To store a sound, the computer measures the waveform’s height again and again, at equal intervals of time. Each measurement is called a sample, and it is kept as a number. The list of samples is the digital representation of the waveform, and it is saved as a sound file. Two settings decide how good the copy is:
- the sample rate: how many samples are taken each second. A music CD takes 44,100 a second; phone calls about 8,000.
- the bits per sample: how many levels each measurement can be rounded to. With 3 bits there are only 8 levels, from 000 to 111; a CD uses 16 bits, 65,536 levels.
What does the amplitude of an audio waveform represent?
Pick an answer to see why.
On a waveform, a singer’s note suddenly shows waves twice as close together, of the same height. What changed?
Pick an answer to see why.
3.3.2 Audio file formats
There are many audio formats, but three are the most common:
- MP3 (MPEG-1 Audio Layer III, often written MPEG Audio Layer 3) is the most used format for sharing music and recordings, because it compresses sound very well. It throws away parts of the sound that the ear can’t pick out (such as a quiet sound right next to a loud one), so a song shrinks to about a tenth of its size with little difference you can hear. It is lossy.
- AAC (Advanced Audio Coding) was made later, as an improvement on MP3. Its methods of compression are more advanced, so at the same file size it usually sounds better than MP3. It is used by YouTube, by iPhones and by many phones’ voice recorders (often in files ending
.m4a). It is lossy too. - WAV (Waveform Audio File Format) usually stores the samples uncompressed, exactly as they were recorded. Nothing is lost, but its files are large. It is used while recording and editing, before the finished sound is saved as MP3 or AAC.
| MP3 | AAC | WAV | |
|---|---|---|---|
| Full form | MPEG-1 Audio Layer III | Advanced Audio Coding | Waveform Audio File Format |
| Compression | lossy | lossy, more advanced | usually none |
| A minute of music | about 1 MB | about 1 MB, sounds a little better | about 10 MB |
| Used for | sharing music and recordings, everywhere | streaming, phones, YouTube | recording and editing |
Which audio format is known for its effective compression and is the most common for sharing audio files?
Pick an answer to see why.
You want to store a recording of your own voice on a computer, keeping it exactly as recorded, to edit later. Which format should you use?
Pick an answer to see why.
3.3.3 Audio editing
To start editing sound, you can use AudioMass, a free audio editor that works in a web browser, at audiomass.co. You can record, cut, add effects and save, with nothing to install.
Its screen has three main areas:
- Menu bar: at the top, with menus such as File, Edit, View, Effects and Help.
- Control panel: the buttons to play, pause, stop and record, the time, and the volume.
- Waveform display: the sound’s waveform, where you select parts to cut, copy, paste, delete or trim.
Recording audio
- Open audiomass.co in your web browser. The editing screen appears.
- Click the Record button (the red circle) in the control panel, or press the R key.
- A New recording dialog box appears. The first time, your browser asks whether the site may use your microphone: click Allow.
- In the Devices section, check that the right microphone is chosen.
- Click Start recording and speak (or play).
- To stop, click Finish recording.
- Click Open recording to open it as a waveform in the editor.
For a clean recording, hold the microphone about a hand’s width from your mouth, in a quiet room with soft things in it, and record a few seconds of silence first (Grade 8, Recording clean sound).
Importing audio
You can also open a sound file you already have:
- Click the File menu at the top left and choose Load from computer.
- A window opens. Find the folder where the sound file is, select it and click Open.
- AudioMass opens the file and shows it as a waveform.
Cutting the waveform
To remove a part you don’t want (a cough, a long pause, the start before anyone spoke):
- Select that part: click at its start and drag to its end. It is marked by a colored box.
- Click the scissors (Cut) button on the toolbar. The selected part is removed, and the sound on either side joins up.
The flat stretches of a waveform are silence, and the tall parts are loud: so you can often see where to cut before you even listen.
Applying effects
Effects change how a sound sounds:
- Select the part of the sound you want to change, by clicking and dragging on the waveform.
- Open the Effects menu. It lists effects such as Normalize (makes the loudest point as loud as allowed, so a quiet recording gets louder evenly), Fade in and Fade out (the sound grows from or dies away to silence), Reverse (plays it backwards), pitch shift (higher or lower), Reverb and more.
- Choose an effect and set its parameters (its settings) if it has any.
- For example, reverb adds the echoes of a room or a hall. Its settings include the time and decay (how long the echoes last and how fast they fade) and wet (how much of the echoed sound is mixed in with the original, the “dry” sound). Click Apply.
- Play the sound to hear the effect. If you don’t like it, use Edit → Undo.
Exporting audio
- Click the File menu at the top left.
- Choose Export / Download.
- A dialog box opens. Type a file name, choose the format (MP3 or WAV), the quality (the bitrate: more kilobits a second sounds better but makes a bigger file) and the channels (mono, one channel, or stereo, two).
- Click Export. The file is saved with your settings.
3.4 Video
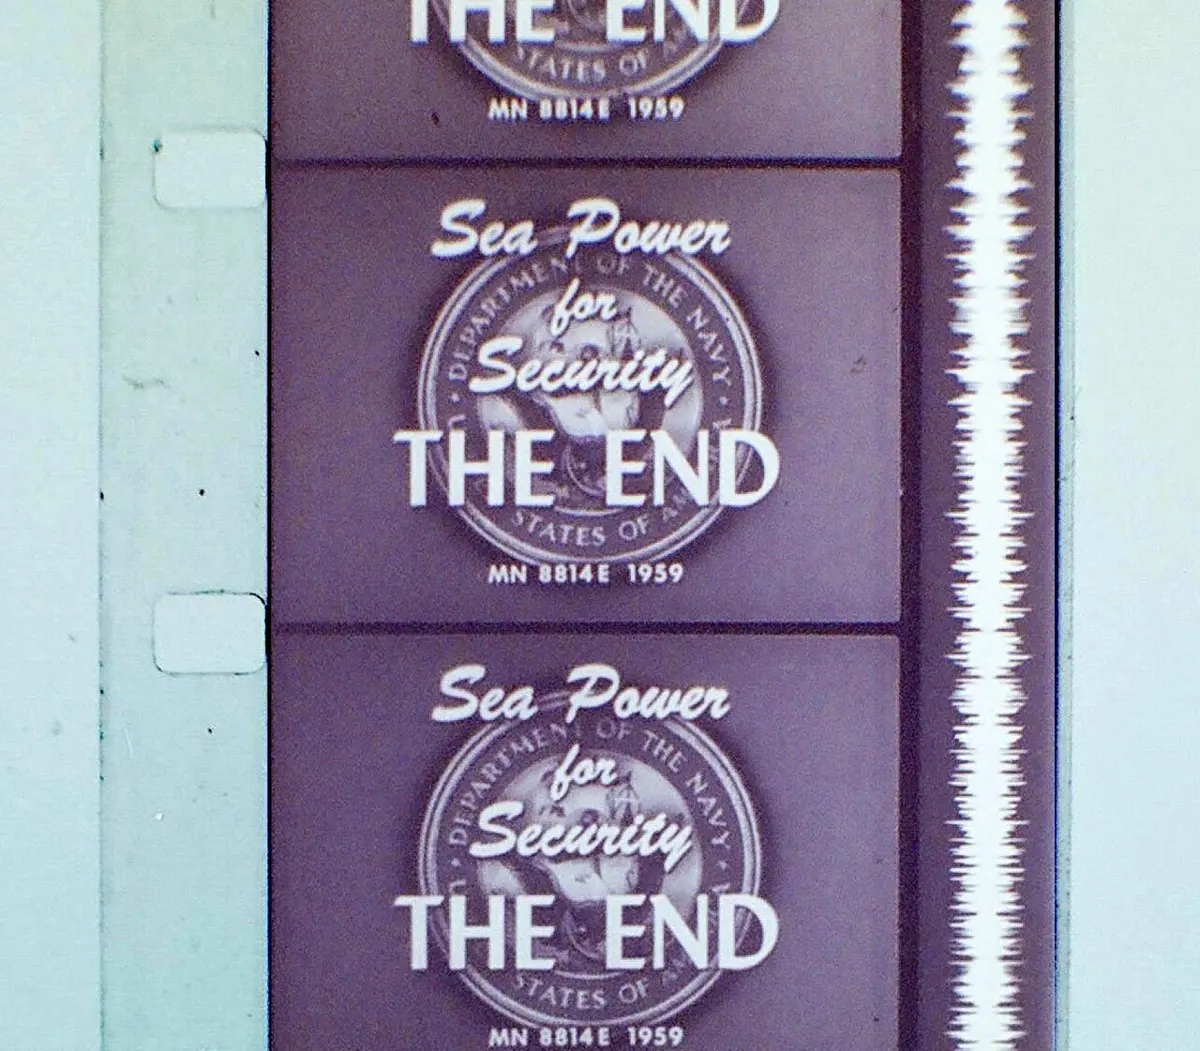
Video is a series of still pictures, called frames, shown one after another so quickly that we see motion. A video usually has an audio track too, which plays in time with the frames. A camera makes a video by taking a photo (a frame) many times a second; a screen plays it by showing those frames in order, just as fast.
3.4.1 Frame rate
The number of frames shown each second is the frame rate, measured in frames per second (fps). The frame rate decides whether a video looks smooth or choppy: the higher the frame rate, the smoother the motion; the lower, the jerkier.
Common frame rates:
- 24 fps: cinema films, since the 1920s, which gives them their slightly dreamy “film look”;
- 25 fps: television in Nepal, India, Europe and other countries that used the PAL TV system, whose electricity runs at 50 Hz;
- 30 fps: television in the Americas and Japan (NTSC), and many phone videos;
- 50 or 60 fps: sport, games and fast action, which need very smooth motion.
Below about 10 or 12 frames a second, most people stop seeing smooth motion and start seeing separate pictures. A higher frame rate costs more: twice the frames means about twice the data to store and send.
A game looks jerky. A friend says the game is running at 8 frames per second. What would make it smoother?
Pick an answer to see why.
3.4.2 Resolution
Pixels are the tiny squares that make up a digital picture (3.2.1). A video frame is a picture too, so it is made of pixels. Resolution is the number of pixels in a frame (or any picture), written as width × height in pixels, such as 720 × 480 or 1920 × 1080. The more pixels, the more detail can be shown: a higher resolution gives a clearer picture, but also a bigger file.
Some resolutions are standards, used by TVs, cameras, phones and video sites:
- SD (standard definition): 720 × 480 pixels. A low resolution, used by old TVs and DVDs. It shows the main shapes, but not much detail. (In countries with PAL television, Nepal and India among them, SD was 720 × 576.)
- HD (high definition): 1280 × 720 pixels (also called 720p). Used by newer TVs and online videos; it shows more detail than SD, but less than FHD.
- FHD (full high definition): 1920 × 1080 pixels (1080p). Used by most TVs, monitors, laptops and phone cameras; it shows a lot of detail, and it is the most common resolution for videos and games.
- 4K UHD (ultra high definition): 3840 × 2160 pixels, four times as many as FHD, for big TVs and cinema.
What does the resolution of a video mean?
Pick an answer to see why.
3.4.3 Video file formats
The three most common video formats are MP4, MOV and AVI:
- a.MP4 (MPEG-4 Part 14) is the most used video format, because it compresses video very well and plays on almost everything: phones, computers, TVs and video sites.
- b.MOV is the format of Apple’s QuickTime movie player. It can hold video that is compressed or uncompressed, as needed, and is used by iPhones and by video editors.
- c.AVI (Audio Video Interleave) is an older format from Microsoft (1992). It can also hold compressed or uncompressed video, but its files are usually bigger than MP4’s.
A video file holds two things, the frames and the sound, so a video format is really a container: a box with a video track and an audio track inside, kept in step. Inside an MP4, the frames are usually compressed by a method called H.264 and the sound by AAC. You may also meet MKV (Matroska), a free container that can hold many sound tracks and subtitles at once, often used for films.
Which video format is most commonly used because it compresses video well?
Pick an answer to see why.
3.4.4 Video editing
To start editing videos, you can use CapCut, a free video editor that works in a web browser and as a phone app (CapCut – Video Editor). You can cut and arrange clips, add transitions, effects and text, and more.
Its screen has four main areas:
- Timeline area: along the bottom, where you arrange and edit your clips, sound, effects and text in time order.
- Tools panel: on the left, with the media, audio, text, transitions, effects and other tools.
- Preview area: in the middle, where you watch the video as it will look.
- Export and share options: at the top right, to save the finished video in a chosen format and share it.
Creating a new project
- Go to CapCut’s website (capcut.com) and sign in.
- On the home page, click Create new video.
- The Select aspect ratio box opens. The aspect ratio is the shape of the video, written as width : height. Choose 16 : 9 for a wide video (TV, laptop, video sites) or 9 : 16 for a tall one (a phone held upright).
- A new project is made, and the editing screen opens.
- At the top left you see “Untitled project”. Click it and type a name for your project.
- The project is renamed.
Importing videos
- Click Media on the left of the screen.
- Click Upload. The upload options open.
- Click From this device. A file window opens.
- Choose the videos, photos or sound files you want, and click Open.
- They are added to the project’s media, ready to use.
Working in the timeline
The timeline shows your video as time from left to right, with the clips in a row on the video track and other tracks for text and sound. The playhead (or timeline cursor), a vertical line, marks the moment shown in the preview.
- Click a clip in the media panel to add it to the timeline, or
- drag it from the media panel onto the timeline, to the place you want it.
- The clips play in the order you place them, from left to right.
- To change the order, press and hold a clip and drag it to a new place.
- Use the zoom slider to zoom in on the timeline (to work on a few seconds exactly) or out (to see the whole video).
- To play the video, click Play in the preview area, or press the Spacebar.
- The playhead moves along the timeline, and the preview shows the video.
- Press the same button (or Spacebar) again to pause, and again to go on.
- Drag the playhead to any point to jump there.
- The playhead’s time is shown below the preview window, at the bottom left.
Trimming and cutting videos
- To trim a clip, drag the handle at its start or its end. This cuts off the part you don’t want at that end, and changes how long the clip lasts.
- To split (cut) a clip in two, move the playhead to the moment where you want the cut, and click Split.
- To delete an unwanted part, split it off, select it, and press Delete. The clips after it move up to close the gap.
Adding transitions
A transition is how one clip changes into the next: a fade, a dissolve (one picture melting into the other), a wipe, a slide.
- Point at the join between two clips, and click Add transition (it appears when you hover there), or open Transitions in the tools panel.
- The list of transitions appears on the left.
- Browse through them, or search for one by name.
- Click a transition to put it on the join.
- Change how long it lasts by dragging the edges of its slider.
- Repeat for the other joins that need one.
Most good videos use few transitions: a plain cut from one clip to the next is what films use most. Save fades for a change of place or time.
Adding effects
Effects change how a clip looks: a filter of colors, a blur, a glow, shaking, slow motion.
- Click Effects on the left panel. The effects menu opens.
- It shows the effects in groups.
- Browse to find the one you want.
- Move the playhead to where the effect should start.
- Click the effect. It is added to the timeline from that point.
- Double-click the effect on the timeline to open its settings,
- and change its properties (its strength, speed and so on).
- Repeat for any other clips.
Adding text
- Click the Text icon on the left.
- Choose plain text (such as Add heading) or a ready-made text template.
- Click Add heading: a text box appears on the preview.
- Double-click the box and type your words.
- Change the font, size, color and position in the Properties panel that opens.
- The text has its own clip on the timeline. Drag its edges to set when it appears and disappears.
Exporting the project
- Make sure the project you want to export is open.
- Click Export at the top right of the screen.
- Click Download.
- Choose the quality, resolution (720p, 1080p…) and frame rate, and the format (MP4), then click Export.
- When the video is ready, click Download to save it on your computer.
3.5 Concept of animation
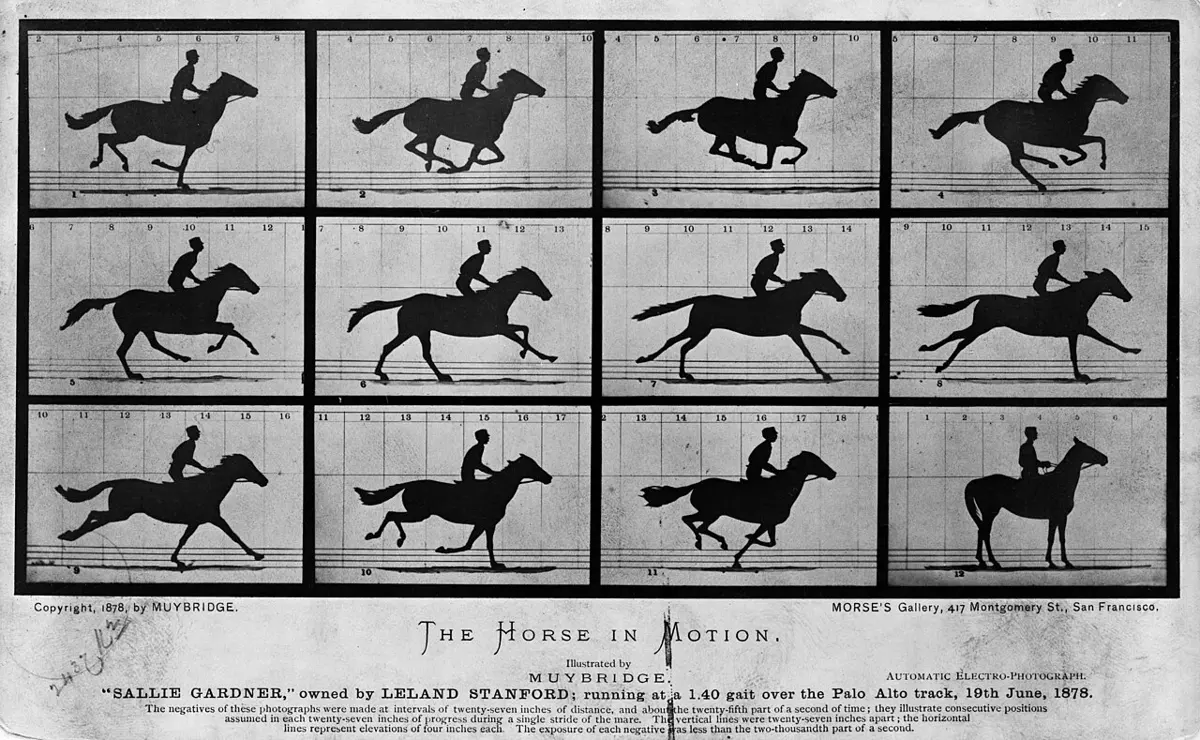
Animation is pictures or graphics that move. Unlike video, nothing is filmed: each picture is made, drawn by an artist or generated (worked out) by a computer, and the pictures are shown one after another, just like the frames of a video. In multimedia, animation usually means movement made on a computer. It is used for cartoons, advertisements, films, video games, websites and lessons (the moving water in Figure 3.1 is one).
Each small change from one picture to the next looks, to your brain, like one thing moving. That is all an animation is: still pictures, slightly different, shown fast.
Psychology, the study of how people think and feel, plays a big part in animation. Animators use what they know about attention and feelings to make their work interesting and easy to follow:
- Bright colors and movement catch the eye quickly. That is why cartoons for children are bright and lively, and why children are drawn to them.
- Faces that show feelings, funny or sad, help viewers connect with the characters and care about the story.
- Smooth, well-timed movement makes an animation enjoyable to watch. A ball that speeds up as it falls and slows down as it rises looks real; one that moves at a steady speed looks stiff and fake.
By understanding what attracts people’s attention, animators make animations that are more fun, more exciting and easier to understand.
Animation is mainly of two types: 2D animation and 3D animation.
3.5.1 2D animation
2D animation is flat: it is made in two dimensions, width and height only, like drawings on paper. It is usually made frame by frame in an animation program: the artist draws each picture, or draws the most important ones and lets the program help with the rest.
Drawing every frame is slow (a minute at 24 fps is 1,440 pictures), so animators work in two steps:
- Keyframes: the animator draws the most important positions, where a movement starts, ends or changes direction. For a bouncing ball, its highest points and the moments it hits the ground.
- In-betweens: the pictures in between the keyframes are filled in, by assistants in the old days, and today usually by the computer, which works out the steps from one keyframe to the next. This is called tweening.
The spacing of the in-betweens decides how the movement feels: frames close together are a slow part, frames far apart a fast part.
In 2D animation, what are keyframes?
Pick an answer to see why.
3.5.2 3D animation
3D animation is made in three dimensions: width, height and depth. Instead of drawings, the animator builds a 3D model inside the computer, which can be seen from any side, with light and shadow and perspective (near things look bigger than far ones), as in the real world. It is made in steps:
- Modeling: the character or object is built as a 3D shape, a mesh of thousands of tiny flat faces, and given its colors and surface (skin, cloth, metal).
- Rigging: a skeleton of bones and joints is put inside the model, so that moving a bone moves the part of the model round it, as your arm moves when you bend your elbow.
- Animating: the animator sets keyframes by posing the skeleton, and the computer works out the in-betweens.
- Rendering: the computer draws every frame as a picture, working out how the light falls on every surface. For a film, this can take hours a frame, on many computers at once.
| 2D animation | 3D animation | |
|---|---|---|
| Dimensions | width and height | width, height and depth |
| Looks | flat, like a drawing | solid, with perspective, light and shadow |
| Made by | drawing frames (keyframes and in-betweens) | modeling, rigging, animating and rendering |
| Seen from | one side only, as drawn | any angle: the camera can move round it |
| Examples | classic cartoons, GIF stickers, explainer videos | animated films, video games, product adverts |
| Programs | Adobe Animate, Krita, OpenToonz, Pencil2D | Blender, Maya, 3ds Max |
In 3D animation, what are the three dimensions?
Pick an answer to see why.
What is the main feature of 2D animation?
Pick an answer to see why.
Exercise
1. Write the full forms
Write the full forms of these abbreviations:
i. RTF ii. PNG iii. GIF iv. JPG v. SVG vi. PDF vii. MP3 viii. AAC ix. MP4 x. AVI
Answer
2. Choose the correct answer
i. What does the term “multimedia” refer to?
Pick an answer to see why.
ii. Which is a drawback of multimedia?
Pick an answer to see why.
iii. Which of these is a standard text file format that stores only text?
Pick an answer to see why.
iv. Which term describes the characters we see on the screen, also known as alphanumeric values?
Pick an answer to see why.
v. What type of computer graphics is made up of Bézier curves and keeps its quality at any size?
Pick an answer to see why.
vi. Which file format is commonly used for sharing documents online and can contain both raster and vector graphics?
Pick an answer to see why.
vii. What does amplitude represent in an audio waveform?
Pick an answer to see why.
viii. Which audio file format is known for its effective compression and is commonly used for sharing audio files?
Pick an answer to see why.
ix. What does resolution in video refer to?
Pick an answer to see why.
x. Which video format is commonly used for storing videos with high compression?
Pick an answer to see why.
xi. In 3D animation, which three dimensions give the animation its perspective?
Pick an answer to see why.
xii. What is the main feature of 2D animations?
Pick an answer to see why.
3. Write short notes
Write a short note on the components of multimedia.
Answer
Write a short note on Rich Text Format.
Answer
Write a short note on the audio waveform.
Answer
Write a short note on video resolution and frame rate.
Answer
Write a short note on raster and vector graphics.
Answer
Write a short note on 2D and 3D animation.
Answer
4. Answer these questions
What are the five main components of multimedia?
Answer
Define raster graphics.
Answer
Name three common raster image file formats.
Answer
Explain the difference between raster and vector graphics.
Answer
Why is multimedia important in education and business?
Answer
How does a DOCX file differ from a TXT file?
Answer
If you had to create a greeting card, which multimedia components would you use, and why?
Answer
Suggest a suitable image format for a company’s logo with a transparent background, and give the reason.
Answer
Which type of graphic, raster or vector, would you use to design a billboard? Justify your answer.
Answer
Compare the use of multimedia on YouTube and Google Earth. What are the similarities and differences?
Answer
Draw a simple interface for a multimedia learning app, and list which multimedia elements you would include, with reasons.
Answer
Evaluate the impact of video content compared with other media (text or audio) in digital communication.
Answer
5. Activities
6. Project work
Practice every question in the book, and keep track of the ones you miss →
A companion to your textbook, not a replacement for it: study from the book your school uses, and where the two differ, follow your teacher. Found a mistake? Please tell us.