
On 28 September 2024 the rain gauge at Kathmandu’s airport caught 239.7 mm of rain in a single day. That was more than the whole of a normal September there, which brings about 208 mm, and far more than the gauge had ever caught in a day before: its old record, from July 2002, was 177 mm. Across Nepal it had been a wet month, about 170% of the usual. Even Jomsom, in the dry country behind the Annapurnas, had nearly four times its normal September rain.
Nobody planning a visit to Kathmandu for the following September would have packed for a day like that, and they would have been right not to. A day like that is weather. What you pack for is climate.
Expected and got
A Scottish geographer called Andrew Herbertson, who had spent time working at the weather observatory on the top of Ben Nevis, put the difference in one line in a textbook he first published in 1901: “Climate is what on an average we may expect, weather is what we actually get.” Trimmed down, it has been quoted ever since, and often credited to Mark Twain, with no sign that he ever said it.
Weather is the state of the air at one place and one time: how warm it is, whether it is raining, how hard the wind blows, how much cloud there is, how damp the air feels. It changes by the hour. Climate is the pattern all that weather makes over many years: the usual warmth of each month, the usual rain, how much it swings from day to night and from season to season, and how often the rare days come.
To pin a climate down, weather services take the averages of thirty years. The World Meteorological Organization sets the rule. The current set, called the climate normals, runs from 1991 to 2020. Thirty years is long enough for a few odd years to wash out. In Kathmandu the normal January night falls to about 3 °C and the normal afternoon reaches about 19 °C, and nobody there needs a forecast to know that winter mornings are cold.
An average on its own can hide a lot, though. The normal July rain at Kathmandu’s airport is 384 mm. In July 2025 the gauge caught 241 mm, and in July 2026 it caught 611 mm. Neither year was “the climate”. Both were weather, and the climate is what you get when you put thirty such years together, wet ones and dry ones alike.
What decides a climate
Pick any place on Earth and ask a handful of questions about it, and you can come surprisingly close to its climate before you look anything up.
How high does the sun climb there at noon, and how much does that change through the year? Near the equator it stands almost overhead in every month, and there is no cold season. Toward the poles the year splits into a warm half and a cold half, more sharply the farther you go.
Does the air overhead mostly rise or sink? Rising air drops its water, in the rain belt near the equator; sinking air, about 30 degrees north and south, keeps the clouds away, and the great hot deserts lie there. The rain belt also slides north and south with the sun, so the places it visits get a wet season and a dry one. The monsoon is the biggest of those visits.
How far is the sea? Water warms and cools slowly, so coasts have mild winters and cool summers, and the middle of a continent bakes and freezes in turn. Then come the local questions: which way the wind usually blows and what it has crossed, whether a range of mountains stands in its way, and how high the place is, since the air cools as you climb.
None of these is new. They are the sun, the air, the sea and the land, working on one place at once. What a climate adds is the long view: averaged over thirty years, each place’s answers make a pattern that comes back year after year. And patterns can be sorted.
Köppen’s letters
The map most geographers use was made by a man who started out studying plants.
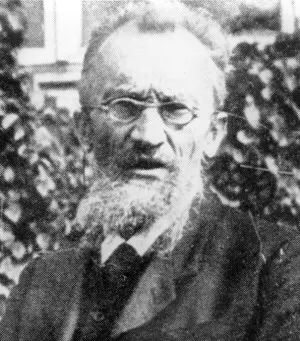
Wladimir Köppen was born in St Petersburg in 1846. As a boy he went to school in Crimea, and the journeys between the cold northern capital and his family’s estate on the Crimean coast, through very different plants and country, are said to have set him wondering how climate and living things fit together. He studied botany, and his doctorate, in 1870, was about how temperature affects the way plants grow. He went on to work on weather, but he kept thinking like a botanist. A forest, a grassland or a stretch of tundra is a kind of instrument: it has lived through every hot summer, cold winter and dry spell of its place for centuries, and its shape records the answer. So when Köppen sorted the world’s climates, he drew his lines where the plants change. He published a first map in 1884, a full system in 1918 and a last version in 1936, four years before he died, and the climatologist Rudolf Geiger carried on with it after him. That is why it is often called the Köppen–Geiger system.
It works with just two things anyone can measure, the average temperature of each month and the rain in each month, and it sorts every place into five groups with a capital letter each.
A is for the tropics, where every month averages at least 18 °C and there is no winter at all. E is for the polar climates, where even the warmest month averages under 10 °C. Köppen held that the tree line, both up a mountain and toward the poles, keeps close to that line, so E is where trees give out: tundra, where a short summer still thaws the ground, or ice, where no month averages above freezing. Between them, C is for climates with mild winters, whose coldest month stays above 0 °C, and D for climates whose coldest month freezes. Köppen himself drew that last line at −3 °C; most maps now use 0 °C. And B is for the dry climates, where the sun and wind could take up more water than the rain brings. Hot places need more rain than cool ones not to count as dry, so the line for B moves with temperature.
A second letter says when the rain comes: f for rain in every season, s for a dry summer, w for a dry winter, and m for the tropics’ monsoon. A third letter says how hot the summer gets: a for a warmest month of at least 22 °C, b and c for cooler ones. So Kathmandu is Cwa: mild winters, a dry winter, a hot summer. Hong Kong, on the coast nearly 3,000 km away, has the same three letters.
Reading the map
Laid on a map of the world, the letters don’t scatter at random. They fall into belts, and the belts follow the questions.
Start at the equator, where the rain belt stays all year. Singapore is the textbook case: every month averages between about 27 and 29 °C, and about 2,100 mm of rain falls through the year with no dry season to speak of. The Amazon and the Congo basins are the same, and so is the great green band across them on the map.
Move away from the equator and the rain belt only visits. Mumbai gets most of its year’s rain while the belt is overhead, from June to September, and very little in winter. Kolkata is the same kind of place, though drier, and its coolest month still averages about 20 °C, so it stays in the tropics. These wet-and-dry tropics, savanna in Africa and monsoon country in Asia, flank the rainforest on both sides.
Then the deserts, under the sinking air. Cairo gets about 25 mm of rain in a normal year, about a tenth of what Kathmandu’s airport caught on that one day in September 2024. The driest of all is the Atacama in Chile; Earth’s Extremes has it, with the hottest, coldest and wettest places on Earth.
A little farther toward the poles, the western coasts get a climate named after the Mediterranean. In summer the sinking air of the desert belt shifts toward the pole and sits over them, so their summers are hot, sunny and dry; in winter it moves back toward the equator and lets in the storms that bring rain. Rome is one, and so are California, central Chile, the Cape in South Africa and the southwest corner of Australia: five pieces of the same pattern on five continents, all on west coasts between about 30 and 45 degrees. On the eastern coasts at the same latitudes it rains in every season, most of all in summer, when warm, humid air comes in off the ocean: Shanghai, the southeastern United States, and, with a dry winter from the monsoon, Hong Kong.
Farther still, west coasts that face an ocean get mild, damp weather all year. London’s coldest month averages about 6 °C and its warmest about 19 °C, and it rains, a little, in every month. But go inland and the sea’s calming hand lets go. Moscow, deep in the continent, averages −6 °C in its coldest month. This D group covers a vast stretch of North America, Europe and Asia on the map, and almost nothing in the southern half of the world. That isn’t a mistake. Between about 40 and 60 degrees south there is hardly any land, only ocean, so there is no continent big enough to get cold in winter. The D climates of the south are a few high mountain patches, in the Andes, Lesotho, the Australian Alps and New Zealand.
Last come the polar climates, at the top of the map and on Antarctica. And they turn up much nearer the equator wherever the land is high enough: high mountain climates sit at every latitude, because climbing a few kilometers cools the air the way traveling thousands of kilometers toward a pole does.
Many climates in a short walk
That last point is Nepal’s.
Nepal doesn’t have one climate. On the same map, drawn in squares a kilometer across, about half of Nepal is Cwa like Kathmandu: the Terai, the valleys and the lower hills. Almost a quarter is Cwb, the same with a cooler summer, on the higher hills. About a fifth is tundra, ET, on the high ground of the Himalaya. One part in twenty has winters that freeze, D. A little is permanent ice, EF, on the highest peaks, and in the rain shadow behind the mountains there are small pockets of dry climate, B. Of Köppen’s five groups, Nepal has four.
The one it lacks is A. Even the Terai, which feels tropical enough in May, has a winter: Biratnagar’s coldest month averages about 16 °C and Bhairahawa’s about 14 °C, short of Köppen’s 18. Older lists of world climates, including the one in CDC’s Grade 10 geography book, put Nepal under “tropical monsoon”, and its summers certainly feel it. By Köppen’s rule the tropics stop well to the south: on the same map the nearest of them are 200 to 450 km away, in India.
The quickest way to see it is to go north from the plains toward Mustang. Bhairahawa, at 108 m, is Cwa: hot, with a dry winter and more than four-fifths of its rain from June to September. Pokhara, at 827 m, is still Cwa. Lumle, on the ridge above Pokhara at 1,738 m, is Cwb: its warmest month averages about 21 °C, too cool for an a. How much rain falls along the way, and why it nearly stops behind the range, is the monsoon’s story.
From Lumle to Jomsom is 54 km in a straight line, and the map along that line reads like a trip from India to the Arctic and on to Central Asia. It runs through Cwa and Cwb in the valleys and on the ridges, then D, where winters freeze, and tundra; back down to C in a deep valley; up again through D and tundra to permanent ice high on the range; down through tundra and D; and finally, in the valley at Jomsom, B: a cold steppe, too dry for anything else, with summers that average only about 18 °C. Four of Köppen’s five groups in 54 km.
Climb anywhere high in Nepal and the same thing happens. The Pyramid, an Italian and Nepali research station at 5,035 m below Everest, has measured an average of −2.4 °C over the year and about 450 mm of rain and snow; on the map it is tundra. Everest’s top is ice.
Going north from Bhairahawa, most of the questions get the same answer all the way. The latitude hardly changes, about 1.3 degrees, and the sea is just as far. What changes is the height, which cools the air, and the mountains, which wring the water out of the monsoon on one side and leave the other side dry. Climates that lie thousands of kilometers apart at sea level, from the edge of the tropics to the Arctic, are packed into the 144 km between Bhairahawa and Jomsom. The plants follow, as Köppen would have expected, and Chapter 26 walks through Nepal’s own climate regions and forests in detail.
A normal, in the end, is a summary of the past. It tells you what thirty years were like, and it is only a good guide to the next thirty if the climate stays put. The World Meteorological Organization still keeps the older normal of 1961 to 1990 on its books, so that every new thirty years can be laid beside the old ones.
Found a mistake? Please tell us.