
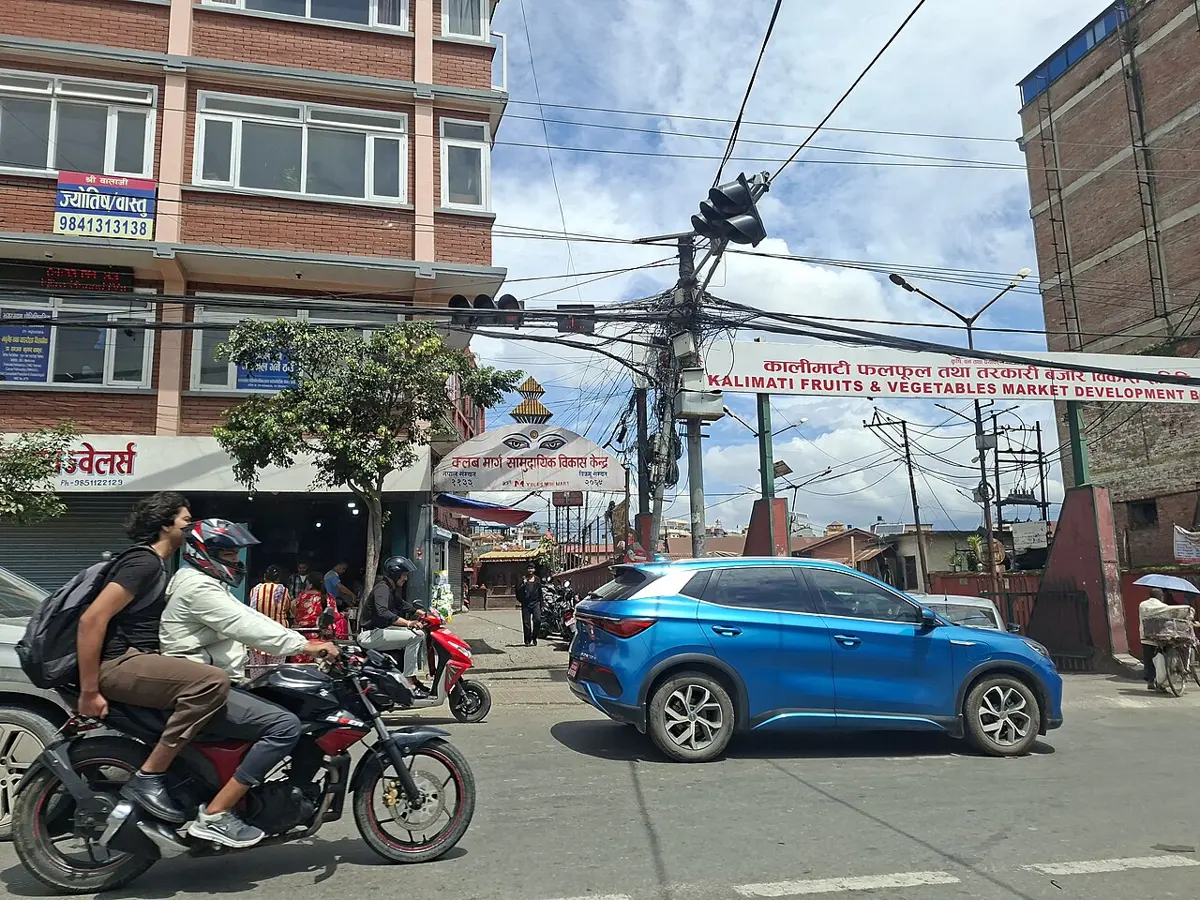
On the morning of 18 June 2023, tomatoes were tipped onto the road outside Kalimati, Kathmandu’s wholesale market, about 90 tonnes of them, and the traffic backed up around the heap. Two days before, large Nepali tomatoes had sold there for Rs. 35 a kilo, and one report said some loads found no buyer that morning even at Rs. 4. The growers said they couldn’t compete with tomatoes from India. The market’s own officials said India had sent hardly any for weeks, and blamed a bumper harvest from the plastic tunnels spreading around the valley.
Eight weeks later, large Nepali tomatoes averaged Rs. 150 a kilo at the same market, and the shops charged Rs. 200 or more. Nepal hadn’t run out. It grows more than 400,000 tonnes of tomatoes a year. What had changed was across the border. Floods had damaged crops in several Indian states, and in India’s cities tomatoes cost almost three times what they had a year before. Now the trucks went the other way: traders sent Nepali tomatoes south, and the loads reaching Kalimati each day fell to about half the 60 to 65 tonnes of the busy season.
The same tomatoes, the same farmers, the same shoppers, and in a few weeks the price was more than four times higher. Chapter 7 gave the tool for making sense of this: two lines, demand and supply, and a price that settles where they cross. A price moves only when one of those lines moves. So the first question to ask about any price that has jumped or crashed is which line moved. The second is how far the price had to go before the market settled again, and that depends on how much buyers and sellers respond when it changes. That response has a name, elasticity, and it’s most of this chapter.
Which line moved
Four things can happen, and each leaves its own mark. If a hailstorm flattens the crop in the hills, less reaches the market at every price: the supply line moves left, the price rises and fewer kilos are sold. If the harvest is huge, the supply line moves right, and the price falls while more is sold. If Dashain is coming and every family wants a goat, the demand line moves right: the price rises, and more goats change hands, not fewer. When the festival is over, the demand line moves back, and both the price and the number sold fall.
That gives a rule worth carrying around. When the price and the amount sold move in the same direction, it was demand that moved. When they move in opposite directions, it was supply. Goats before Dashain get dearer and more are sold, so that’s demand. Tomatoes in August 2023 got dearer and fewer reached Kalimati, so that’s supply, even though the cause was hungry buyers in India: from Kathmandu’s side of the market, tomatoes had simply left.
A closed border works the same way, only faster. Nepal buys nearly all its onions from abroad, mostly from India: about 180,000 tonnes in one year. On 8 December 2023, India stopped onions from leaving the country until the end of March. Within a week the price of a kilo in Kathmandu’s shops had gone from about Rs. 120 to Rs. 200. One Saturday about 22 tonnes reached Kalimati and were gone in minutes, and the market stopped printing a price for onion at all. Supply had moved left, and there was nothing to replace it quickly.
Sometimes both lines move at once, as when a festival comes in the same week as a flood. Then the price surely rises, since both pushes point that way, but whether more or less is sold depends on which push was bigger. Economists can say which way each line went and still have to wait for the numbers to know the rest.
How far: elasticity
Suppose the price of salt doubled tomorrow. Most families would go on putting the same pinch in the dal. Salt has nothing to take its place, a family needs only a little, and it’s such a small part of the month’s spending that even double the price hardly shows. Now suppose one brand of instant noodles went up by a few rupees a packet. Right beside it on the shelf are a dozen other brands that taste nearly the same, and many buyers would simply reach for another.
Economists measure this difference with a number, the price elasticity of demand, मागको मूल्य लोच. It’s the percentage change in the amount people buy, divided by the percentage change in the price. Percentages make goods comparable: kilos of salt and packets of noodles, prices in rupees and prices in dollars can all be set side by side. Since a higher price means less bought, the answer comes out negative, and economists usually just drop the minus sign.
Here is the sum, measured from the starting price. Say Anshu raises the price of her glass of tea from Rs. 25 to Rs. 30, which is 20% more, and the glasses she sells in a day fall from 200 to 180, which is 10% fewer. Her customers’ elasticity is 10 ÷ 20 = 0.5. For every 1% she adds to the price, she sells half a percent fewer glasses. The numbers are made up, but a tea shop with regulars on the way to work would expect something like them.
The number sorts goods into kinds. Above 1, demand is called elastic: buyers respond more than the price moved. Below 1, it’s inelastic: they respond less. Exactly 1 is unit elastic, and two extremes complete the set, though neither is ever quite met in real life. Perfectly inelastic demand doesn’t change at all with the price, like a man dying of thirst in a desert offered water. Perfectly elastic demand vanishes at the smallest rise, like a farmer who asks a rupee more than everyone else at the haat for the same potatoes.
The most useful thing elasticity tells a seller is what happens to her takings, which are the same thing as what her buyers spend: the price times the amount sold. Anshu used to take in 200 × Rs. 25 = Rs. 5,000 a day. Now she takes in 180 × Rs. 30 = Rs. 5,400. Because her customers are inelastic, raising the price brought in more money even though she sold less. If they had been elastic, if a 20% rise had cost her a third of her customers, she’d have taken in less. A seller facing inelastic buyers gains by raising the price, and one facing elastic buyers gains by cutting it.
What makes demand elastic or inelastic comes down to a few things. The first is how many good substitutes there are: one brand of noodles has many, salt has none. The second is how much a thing is needed. A necessity like rice is bought whatever it costs, while a trip to a restaurant can wait. The third is how big a share of the budget it takes, since a rise in something that costs little is hardly noticed. The fourth is how broadly the good is drawn. Food as a whole is very inelastic, because people must eat, but any one food has others it can be swapped for. Habit matters too. Cigarettes have been measured at about 0.3: a 10% rise in the price cuts adult smoking by about 3%, though young smokers respond more.
The last is time, and it’s the one people forget. When petrol gets dearer, people still have to get to work next week, so in the short run they buy almost as much. Over years they buy smaller motorbikes, move nearer work or share a ride, and the response grows. One textbook’s table of estimates puts petrol at about 0.35, electricity at 0.2, and restaurant meals at more than 2: people eat out much less when it gets dearer, but keep the lights on.
Richer, dearer, and later
Price isn’t the only thing buyers respond to, and the same kind of number measures the others.
The income elasticity of demand, मागको आय लोच, is the percentage change in the amount bought divided by the percentage change in income. Chapter 3 sorted goods as normal or inferior, necessities or luxuries, and this number puts those sortings on one scale. If it’s negative, the good is inferior: people buy less of it as they get richer, like coarse rice. At about zero, income makes no difference to what people buy. Between 0 and 1, it’s a necessity: people buy more, but less than in proportion to their income. At exactly 1, they buy more in step with their income. Above 1, it’s a luxury, bought more than in proportion, like a holiday or a car. In 1857 a German statistician, Ernst Engel, put into words a pattern from the household accounts of Belgian working families that has held up ever since in country after country. The poorer a family, the larger the share of what it spends that goes on food. As income rises, families spend more on food, but the share falls, so food has an income elasticity below 1. In Nepal today the poorest fifth of people put about 60 of every 100 rupees of what they use into food, and the richest fifth about 43. That’s also why poor households feel a rise in food prices so much more than rich ones.
The cross elasticity of demand, मागको छड्के लोच, links two goods: the percentage change in the amount bought of one, divided by the percentage change in the price of the other. When tea gets dearer, people drink less of it and buy less sugar to go in it. Sugar and tea are complements, and their cross elasticity is negative. When tea gets dearer, some people switch to coffee, so tea and coffee are substitutes, and theirs is positive. Salt and motorbikes have nothing to do with each other, and theirs is about zero. The bigger the number, the closer the link: one brand of noodles and the brand beside it would have a very large one.
Sellers respond too. The price elasticity of supply, पूर्तिको लोच, is the percentage change in the amount sellers offer divided by the percentage change in the price, and it comes in the same five kinds. Here time matters even more than for buyers, because things take time to make. Alfred Marshall, whose crossing lines filled Chapter 7, showed it with a fish market. On any one day, the fish already landed is all there is, whatever the price, and its price swings with the weather. Over a year or two, a higher price sends more boats out, and more fish arrive. Over a generation, more people learn to fish and better boats and nets are built, and Marshall thought the price could even end up lower than it started, unless the fish began to run out.
Tomatoes follow the same steps. Once picked, they must be sold within days, so the morning’s tomatoes at Kalimati are what there is, and supply that day is close to perfectly inelastic. Over a season, farmers can plant more or less. Over years, they can build plastic tunnels and grow tomatoes in months they couldn’t before. Some things can hardly be supplied at all. No price will make more land in the middle of Kathmandu. Other things are easy: a noodle factory with spare machines can run another shift tomorrow, so its supply is very elastic.
This is why some prices swing wildly while others barely move. A crop that spoils fast, that no one can grow more of quickly, and that people buy about the same amount of whatever its price, is fixed on both sides. When anything moves one of its lines, the price has to do all the moving. That was the tomato’s summer of 2023.
When a good harvest is bad news
In 1699 the English writer Charles Davenant printed a rule of thumb for grain, usually credited to his friend Gregory King, who estimated England’s people and wealth. A harvest a tenth short, it said, raised the price by three-tenths, and a harvest half short sent it to nearly five times its usual level. Since people need bread whatever it costs, a small shortage sends the price up by a lot.
Turn that round and it becomes a puzzle for farmers. If people eat about the same amount of grain whatever it costs, then a harvest that is a tenth bigger than usual has to drop the price a lot before buyers will take the extra. The price falls by more, in percentage terms, than the amount sold rises. So the farmers, all together, take in less money for a bigger crop. It’s what the rice in the widget above does when its price falls.
One farmer with a good harvest is still better off: her bigger crop barely touches the market price. The trouble comes when every farmer has a good year at once. What is true for one farmer isn’t true for all of them together. Fresh vegetables show the same swing, and June 2023 at Kalimati was, by the market officials’ account, just such a year: the tunnels had made more tomatoes than the valley would buy at a price worth the picking. Cheap tomatoes are good news for whoever buys them. The farmers who had grown them lost.
Holding a price in place
Sometimes a government decides it doesn’t like the price the lines have set, and sets one itself. A price ceiling is the highest price anyone may charge. A price floor is the lowest anyone may pay.
A ceiling only matters when it’s below the crossing, and then it does exactly what the Market Board shows. At the held price, buyers want more than sellers bring. In a free market the shortage would push the price up until the gap closed, but now it can’t, so the gap stays. Something else has to decide who gets the goods: who arrives first, who waits longest, who knows someone. And a second market grows up beside the official one, where people who can’t wait pay what the lines would have set, or more.
Nepal saw this in the autumn of 2015. The Nepal Oil Corporation, owned by the state, imports the country’s petrol and sets the price at the pump itself, so the price doesn’t follow the market from day to day. That September, after Nepal’s new constitution, trucks from India all but stopped crossing the border. Nepal’s government said India was blocking them. India denied it, and said the trucks were held up by protests on the Nepali side against the constitution. Either way, little fuel got through, while the official price of petrol stayed at about Rs. 104 a liter. The government rationed fuel and allowed driving only on alternate days. A taxi driver in Kathmandu said that getting petrol through the queue meant at least three days of waiting. By December petrol was selling on the black market in the Kathmandu Valley for Rs. 300 to Rs. 450 a liter, and in twelve days the police arrested 111 people for selling it.
The most studied ceiling in the world is rent control, which limits how much a landlord can raise the rent. San Francisco brought more of its flats under rent control in 1994, and a careful study of what followed found both sides of the story. Tenants in controlled flats were about 20% less likely to have to move, and fewer were pushed out of the city. But landlords whose buildings came under control cut the number of flats they rented out by about 15%, selling them or rebuilding them as homes to own. That made rented flats scarcer, which probably pushed up rents for everyone not lucky enough to have a controlled one already.
A floor works the other way. It matters only when it’s above the crossing, and then sellers bring more than buyers want, leaving a surplus. Nepal’s government sets a minimum support price for paddy each year, the least a farmer is meant to be paid. For the crop harvested in the autumn of 2025 it was about Rs. 3,460 to Rs. 3,630 a quintal (100 kilos), depending on the kind of paddy. But a floor is only real if someone buys what doesn’t sell at that price, and the buying falls to a government-owned company that takes only a small share. In Banke, which grows about 1.6 million quintals of paddy, a report early in 2026 found it had bought only 20,000, about one quintal in eighty. Rich countries spend far more on their farmers: the European Union planned to spend about €58 billion a year supporting its farmers, around a third of its whole budget.
Whether a government should set a price at all is something economists argue about, and here the argument isn’t even. Against controls, most of the profession points to the shortages and surpluses, the queues and black markets, and the way a held price helps whoever happens to get the goods rather than whoever needs them most. When a panel of 41 leading economists in the United States was asked in 2012 whether rent control in New York and San Francisco had improved the supply of affordable housing, one agreed and 33 disagreed. Many say other tools, such as giving poor families money, can reach the same aim with less harm. On the other side, a held price protects people from a sudden jump they can’t plan for, and the tenants who keep their homes, and their children’s schools, are real gains, as San Francisco showed. Even the critics grant that current tenants benefit in the short run. What divides the two is mostly how much weight to give to the people inside the controlled market and to those left outside it, and that’s a question of values as much as evidence.
So the first thing to ask about a price that has jumped is which line moved. When the price and the amount sold move together, demand moved; when they move apart, supply did. How far the price goes depends on elasticity, the percentage response to a percentage change. Buyers respond little when a good has no substitutes, is a necessity, takes a small part of their budget, or when they’ve had little time to adjust, and sellers respond little when they can’t make more quickly. Where both sides respond little, as with fresh vegetables, prices swing hard, and a big harvest can leave farmers with less money than a small one. A government can hold a price in place, but then the shortage or the surplus stays, and something other than the price decides who goes without.
Found a mistake? Please tell us.