
Late one night in the autumn of 1955, a young economics teacher at Purdue University in the United States lay awake at three in the morning, thinking about a classroom game. His name was Vernon Smith, and not long before, as a graduate student at Harvard, he had taken part in it: the economist Edward Chamberlin ran it with his graduate students.
Chamberlin gave each student a card. A buyer’s card showed the most he could pay for one unit of an imaginary good. A seller’s card showed the least she could accept. Then the students walked around the room, bargaining in pairs, and every deal was written on the blackboard. At the end Chamberlin showed the two lines that the cards added up to, the lines this chapter is about, and showed that the prices on the board had wandered well away from where the lines said they should be. The lesson, as the students took it, was that the theory didn’t work.
Smith thought the idea of an experiment was right but the market was wrong. If the theory was going to fail, it should fail in a market built the way real exchanges are, where it had the best chance. So he changed two things. His buyers and sellers would call out their offers to the whole room, as traders do on a stock exchange, and the market would open again for several “days”, with the same cards each time. He tried it on his class the following January. “I am still recovering from the shock of the experimental results,” he wrote years later. “The outcome was unbelievably consistent with competitive price theory.” He didn’t believe it, and ran it again with another class and other cards, and then again for years.
In the first market he reported, the cards were set so that the lines crossed at $2.00. Nobody in the room knew that. Each student knew only his own card. The first deal of the first trading day was struck at $1.70, and that day’s deals averaged $1.80. By the third day they averaged $2.02, and they stayed there. In all five days, no deal went below $1.70 or above $2.25. A room of students, each looking after his own card, had found the one price the lines pointed to, without anyone telling them what it was.
The cards had added up to two lines, one for what the buyers would pay and one for what the sellers would take, and the prices settled where the lines crossed. Those two lines, and the reason a crowd of strangers finds where they cross, are what this chapter is about. In 2002 Smith shared the Nobel prize in economics for experiments like these.
What a market is
A market, to an economist, isn’t a place. It is all the buyers and sellers of one thing who can reach each other and agree a price. Sometimes that is a place too.
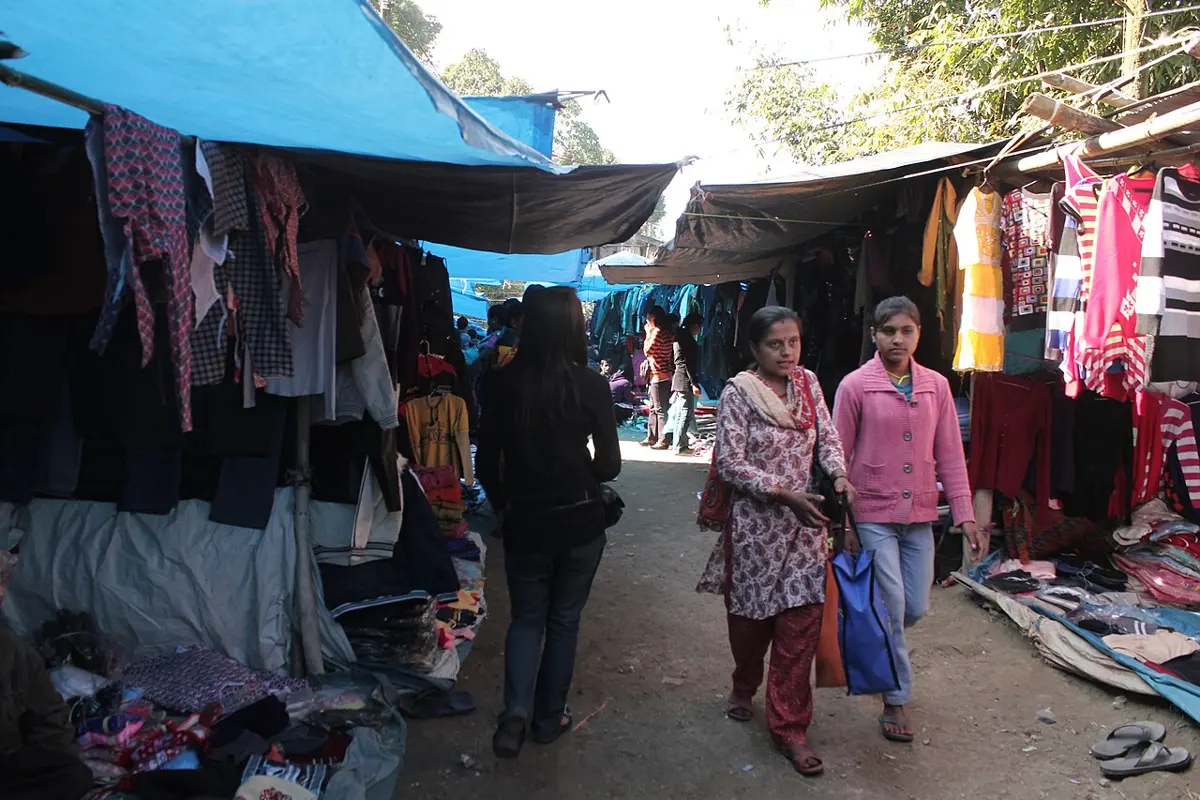
In much of Nepal the oldest kind is the हाट (haat), a market that comes alive on one day of the week. Farmers carry in vegetables, traders bring clothes and pots, and by evening the lane is empty again. Kalimati in Kathmandu is the same idea on a bigger scale. It has run since 1986 as the valley’s wholesale market for fruit and vegetables, and every day the board that runs it publishes the lowest, highest and average wholesale price of more than a hundred items. On the day this chapter was written, 21 November 2026 (5 Mangsir 2083), large Nepali tomatoes sold there for Rs. 60 to 70 a kilogram, wholesale.
A market can also be a phone. On a shopping app the buyers and sellers never meet, and on a ride app the price is offered and accepted before the bike arrives. There are markets for things nobody can hold, like hours of work, and markets where the thing traded is money itself, rupees for dollars, which later chapters open up. What makes each one a market is the same: people who want something, people who have it, and a price both sides can see.
Not everything has a market. Air is free because there is plenty for everyone, so nobody pays for it. A streetlight is hard to sell, because nobody can be stopped from walking under it. Those are the free goods and public goods of Chapter 3. This chapter is about everything else, the ordinary goods that someone makes and someone else pays for.
Why buyers buy less when the price rises
In everyday speech, demand means wanting. In economics it means more than that. Demand, माग, is wanting something and being able to pay for it and being willing to. A boy who would love a motorbike but has no money doesn’t add to the demand for motorbikes. Neither does a rich man who could buy ten but doesn’t want one. And all three have to meet a thing that is there to be bought.
Take the tomatoes at a weekly haat in the town where Anshu, the tea shop owner of this book, lives. The town, the haat and every number in this section are made up, but they behave as real ones do. Anshu buys tomatoes for her family. At Rs. 40 a kilo she might take 2 kilos, at Rs. 60 just 1, at Rs. 20 perhaps 3. The momo shop next door uses far more: at Rs. 40 it buys 15 kilos, at Rs. 20 it buys 20. A list like this, how much one buyer would buy at each price, is that buyer’s demand schedule. Add up every buyer at the haat, price by price, and you get the market’s demand: how many kilos the whole crowd would buy at each price that might be asked.
Nearly everywhere and for nearly everything, that list runs the same way. The higher the price, the less people buy. This is the law of demand, मागको नियम. There are several reasons, and they work together. When tomatoes get dearer, some people use less and put in more onion or a spoon of tomato paste instead, because something else now does the job more cheaply. The same Rs. 200 also buys fewer kilos than before, so a family that has to stop somewhere stops sooner. And at a low price people buy who wouldn’t have bought at all: the momo shop makes extra achar, a family buys a few kilos to dry. Each extra kilo matters less to a buyer than the kilo before it, so it’s only worth buying if the price is low enough.
Drawn on a graph, the market’s demand is a line that slopes down. By an old habit, economists put the price up the side and the amount along the bottom, so the line runs from top left to bottom right: few kilos at a high price, many at a low one. The whole line is the demand. One point on it, the amount people want at one price, is called the quantity demanded.
That difference sounds like a fuss over words, but it is the most useful idea in the chapter, because it separates two very different things. If the price of tomatoes goes up and people buy less, nothing about the buyers has changed. They have simply moved along the same line to a new point. But the whole line can move too, when something other than the price changes what people want. Then the crowd wants more, or less, at every price.
Plenty of things move it. Income is one. When families earn more, they buy more of most things, which are called normal goods. But they buy less of a few, called inferior goods, because they can now afford something they like better: coarse rice gives way to finer rice, and a bus seat to a motorbike. The prices of other goods matter too. Goods that stand in for each other are substitutes, like tea and coffee. When gas for cooking gets scarce and dear, an electric induction stove looks better, and more people want one at the same price as before. Goods used together are complements, like a motorbike and petrol, and when petrol gets dearer, fewer people want motorbikes.
Tastes move the line, and advertising tries to. So do the seasons: jackets sell in Poush, umbrellas in Saun, and the demand for goats and new clothes climbs before Dashain, as more buyers come in. A loan that’s easy to get moves it, because a motorbike or a house paid for in monthly installments is suddenly within reach. And what people expect matters: if everyone hears that prices will rise next week, or that the road will close, they buy now, which raises the demand today.
Some cases look at first as though the law of demand had failed, and are really the line moving. A family whose income has doubled may buy more tomatoes at a higher price, but it is a different family now, on a new line. People who fear a shortage buy more as prices climb, but it is the fear, not the price, that moved them. A few strange true exceptions exist, like the Giffen goods of Chapter 3, which the very poorest buy more of when their price rises, but they are rare enough that the best evidence for one took economists over a century to find.
Why sellers offer more when the price rises
On the other side of the haat are the sellers. Supply, पूर्ति, is how much of a thing sellers are willing and able to offer at each price. It needs both. A farmer who would like to sell tomatoes but has none can’t supply them, and a trader with a full shed who won’t sell at today’s price isn’t supplying either.
Here the list runs the other way. The higher the price, the more sellers bring. This is the law of supply, पूर्तिको नियम. One reason is the village in Chapter 3. Growing more tomatoes means giving a field, a morning or some fertilizer to tomatoes that could have gone to something else, and each extra crate costs more than the one before, as the land that is less suited to tomatoes comes in. Only a higher price makes that extra crate worth growing. Another is that a better price draws in new sellers. A farmer two hours’ walk away decides the trip is worth it, a trader in the next town sends a load, and a family with a few plants behind the house brings a basket. And a seller who could take her tomatoes somewhere else, or keep them a day, brings them here instead.
As with demand, each seller has a schedule, and adding them all up at each price gives the market’s supply. On the graph it is a line sloping up, from bottom left to top right.
And as with demand, moving along the line is one thing and the line moving is another. If the price rises and farmers bring more, that is a move along the same supply line. The whole line moves when something else changes what sellers can offer at every price. Costs are the biggest. When seed, fertilizer or the diesel to run a truck gets dearer, each crate costs more to grow and carry, and less arrives at every price. Better methods do the opposite: a new variety, a plastic tunnel that keeps the frost off, a pump that brings water to a dry field all let farmers grow more for the same cost. The weather moves the line, so a hailstorm in the hills or a good dry season in the Terai changes what reaches the haat. The number of sellers moves it. A new road moves it too, since a farmer who once carried his crop for a day can now put it on a truck. Taxes push the line back, by adding to what each crate costs, and subsidies push it out. Even other crops move it: if cauliflower starts paying much better, some fields that grew tomatoes will grow cauliflower next season.
Where the lines cross
On one graph, a line sloping down and a line sloping up cross at one point. At that price, and only at that price, the buyers want exactly as much as the sellers have brought. Economists call this the equilibrium, बजार सन्तुलन: the market’s resting point. The price there is the equilibrium price, and the amount is the equilibrium quantity.
The more useful question is what happens at any other price, because that is what makes a crowd find the crossing. Suppose the haat opens with tomatoes at Rs. 30 a kilo. At that price the crowd wants 400 kilos, but sellers have brought only 200. There is a shortage. Tomatoes run out early, people who came late go without, and a seller who sees five buyers at her basket realizes she could ask more. As the price creeps up, some buyers drop out and some sellers fetch the rest of their crop, and the gap closes. Now suppose the price starts at Rs. 50. Sellers have brought 400 kilos and buyers want only 200. There is a surplus. By afternoon, sellers with full baskets and a long walk home start cutting their price before the tomatoes soften. In both cases the price moves toward the crossing, and it stops moving only when nobody is left wanting to buy who can’t, or wanting to sell who can’t.
Nobody gives orders for any of this. No official at the haat calculates the right price. Each buyer and seller watches the crowd around them, and the price that clears the market falls out of thousands of small decisions. It is the same thing Smith saw in his classroom, where students who knew only their own cards found the price the lines had set.
The lines can also be written as numbers, and then the crossing is one small sum. Say that at the haat, at a price of P rupees a kilo, the buyers want 700 − 10P kilos. The 700 is how many kilos they would take if tomatoes were free, and the 10 says how many kilos fewer they want for each rupee the price goes up. Say the sellers bring 10P − 100 kilos: none at all below Rs. 10, then 10 more kilos for each rupee. At the crossing the two amounts are equal:
so 20P = 800, and P = 40. At Rs. 40 a kilo the buyers want 700 − 400 = 300 kilos and the sellers bring 400 − 100 = 300. Written like this, as an amount that depends on the price, each line is called a function: the demand function, माग फलन, and the supply function, पूर्ति फलन. Every straight line can be written with these two parts, a starting number (the intercept) and a steady change (the slope), and two points are enough to find them. If buyers want 400 kilos at Rs. 30 and 200 at Rs. 50, each rupee on the price costs 10 kilos. Taking the price 30 rupees down from Rs. 30 to nothing adds 300 kilos, so the line starts at 700: 700 − 10P. That is why Nepal’s economics books, from Grade 9 on, write demand and supply this way. It turns the crossing into a sum anyone can do.
When a line moves, the crossing moves with it. If a hailstorm flattens the plants in the hills and less reaches the haat at every price, the supply line moves to the left. At the old price of Rs. 40 there is now a shortage, and the price climbs until the gap closes, at a higher price and fewer kilos sold. If a wedding season brings more buyers, the demand line moves right, and the price climbs again, but this time with more kilos sold. Which line moved, and by how much, is the subject of the next chapter.
People argued for a long time over which side sets a price. Some said value came from how useful a thing is to buyers. Others said it came from what it costs to make. Alfred Marshall, the English economist whose Principles of Economics of 1890 put these lines in nearly every textbook since, answered with a picture: “We might as reasonably dispute whether it is the upper or the under blade of a pair of scissors that cuts a piece of paper, as whether value is governed by utility or cost of production.” Neither blade cuts alone.
The lines themselves are older than Marshall’s book. A French mathematician drew a demand line in 1838, and a German economist drew both lines crossing three years later, with price up the side, as it is still drawn. In Britain, in 1870, an electrical engineer and inventor named Fleeming Jenkin, who had no training in economics, drew them again on his own. Not everyone was pleased. When a German economist named Hans von Mangoldt died, the man who reprinted his book took the diagrams out, because, he wrote, it was “utterly inconceivable” to him that graphs could help anyone understand economics.
Always on the move
The crossing is where a market is heading, not where it always is. Real lines move all the time. A haat on a rainy morning is a different market from the same haat a week later, and the price is always chasing a crossing that may have moved again before it gets there. Kalimati’s prices change from one morning to the next. What the two lines give is the direction: if the price is below the crossing, expect it to rise; if it is above, expect it to fall; if a line moves, expect the crossing to move with it. Economists find that more useful than any forecast, and Smith’s later experiments showed that markets find the crossing even with as few as six to eight traders, calling their offers to the whole room.
The lines also say nothing about whether the price is fair. A crossing at Rs. 40 a kilo is simply where buyers and sellers agree. If a family can’t afford tomatoes at that price, the market doesn’t notice, because the demand line counts only wanting that comes with money. Whether something should be done about that, and what, is a question the next chapters keep returning to.
So a market is buyers and sellers of one thing who can deal with each other, at a haat or on a phone. Demand is what buyers want and can pay for at each price, and they want less when the price rises. Supply is what sellers will offer at each price, and they offer more when it rises. A change in the price moves people along those lines. A change in anything else, income, other prices, tastes, seasons, costs, weather, roads or taxes, moves the lines themselves. Where the two lines cross, the buyers want just what the sellers bring, and at any other price a shortage or a surplus pushes the price back toward that point, without anyone in charge.
Found a mistake? Please tell us.