
In mid-October 2026 the things a Nepali family buys cost 6.37% more than they had a year before. A year earlier the same figure had been 1.47%. Ghee and cooking oil were up 16%, fruit 15%, sugar 12%, and the cost of getting about 13%. Anshu’s tea shop runs on milk, sugar and gas, and she still sells a glass for Rs. 25. Each glass now costs her more to make, and sooner or later she will have to decide whether to charge more for it.
A rise in the general level of prices, kept up over time, is inflation, मुद्रास्फीति, and in everyday Nepali महङ्गी. The level itself, the price level, मूल्यस्तर, is an average: not the price of tea or of rice, but of everything a family buys, taken together. When it falls instead, that is deflation, मुद्रा सङ्कुचन or विस्फीति. Chapter 5 put the price level on the economy’s dashboard. This chapter opens it up: how the average is made, why it rises, why India has so much to do with it, and who wins and who loses when it does, and why prices that fall can be worse still.
Weighing the basket
Nobody can price everything, so Nepal Rastra Bank prices a basket. Each week, month or quarter, depending on the item, its staff note the prices of 525 goods and services in 87 markets across all 77 districts, from milk, sugar and cooking gas to petrol, the rent of a flat and a private school’s fees. Some prices matter more than others, because families spend more on them. So each item gets a weight, its share of what households spend, and the weights come from a survey: the statistics office’s Nepal Living Standards Survey, which recorded what 9,600 households bought between July 2022 and June 2023. Food and drink take 35.5% of the basket. Rent for a flat alone takes 8.8%, milk 2.5%, petrol 1.4%, cooking gas 1.2%, a Grade 8 pupil’s fees at a private school 1.2%, tea 0.7%.
The bank then works out what the whole basket costs, and compares it with what it cost in a starting year, the base year, आधार वर्ष, which is now 2023/24. The base year’s cost is called 100. If the same basket costs 106.37 a year later, prices have risen 6.37%. This number is the consumer price index, उपभोक्ता मूल्य सूचकाङ्क, and a price index, मूल्य सूचकाङ्क, of any kind is the same idea: a basket’s cost today as a share of its cost then, times 100.
Families’ baskets don’t stand still, so every few years the bank weighs them again. Between the old basket, whose base year was 2014/15, and the new one, food fell from 39.9% to 35.5% of spending, grains alone from 11.3% to 8.1%. Meals in restaurants and hotels rose from 2.9% to 8.0%, and health from 3.5% to 5.5%. Some of that change lies in how the two surveys counted, and some in how families now live. An old basket goes on weighing rice as if it still mattered as much as it once did.
That points to a puzzle with every price index, and two economists of the 1870s gave it their names. Here is a made-up family with three things in its basket, in two years.
| Last year | This year | |
|---|---|---|
| Rice | 30 kg at Rs. 80 | 30 kg at Rs. 84 (up 5%) |
| Cooking oil | 5 liters at Rs. 250 | 4 liters at Rs. 350 (up 40%) |
| Vegetables | 20 kg at Rs. 60 | 22 kg at Rs. 60 (no change) |
Oil has shot up, so the family uses a liter less and buys more vegetables instead. How much have its prices risen? Étienne Laspeyres, a German economist, answered in 1871: take last year’s basket and price it both years. Last year it cost Rs. 4,850. The same 30 kg of rice, 5 liters of oil and 20 kg of vegetables would cost Rs. 5,470 this year, so prices rose 12.8%. Hermann Paasche answered in 1874: take this year’s basket instead. At last year’s prices it would have cost Rs. 4,720, at this year’s it cost Rs. 5,240, a rise of 11.0%.
Both are honest sums, and they disagree. Laspeyres’s index pretends the family went on buying 5 liters of oil at the new price, when it didn’t: so it overstates what the rise really cost the family. Paasche’s pretends the family would have bought this year’s mix last year too, so it understates. The gap between them is called substitution bias, because people swap away from whatever has grown dear. The American economist Irving Fisher suggested in 1922 taking a kind of average of the two, which here comes to 11.9%, and statisticians still call it the ideal index. Nepal’s index is the Laspeyres kind, with the basket fixed by the survey, which is the usual choice, because last year’s basket is known and this year’s takes a new survey to find. That is one reason baskets are weighed again. Another is that goods change. A new kind of good can take years to enter a basket at all: air conditioners joined the American index only in 1964, long after many families had one. And a good that gets better for the same price, like a phone, is really cheaper, which a list of prices doesn’t show.
Every family’s basket differs from the average one. A family that rents, drives a motorbike to work and has two children in a private school faces different prices from a farming family that grows its own rice. In mid-October 2026 prices had risen 6.6% in the villages and 6.3% in the towns, 7.4% in Madhesh and 5.1% in Sudurpashchim. Try your own.
With an index in hand, a sum in rupees can be turned into a real one. A nominal figure, in the rupees of the day, says nothing until it is set against prices; the real figure divides by the price index and multiplies by 100. Chapter 12 did this for wages and deposits, and Chapter 13 for the whole of GDP with its own index, the deflator. The rule is always the same: a rise in rupees is a real rise only by as much as it beats the rise in prices. In the year to October 2026 Nepal’s wage index rose 10.75% against prices’ 6.37%, so a typical wage bought about 4% more. A deposit that paid 3.07% bought about 3% less.
Why prices rise
Economists sort the causes into a few kinds, and most real bouts of inflation have more than one.
The first is too much spending. When families, firms and the government together want to buy more than the economy can make, sellers find customers waiting and raise their prices. This is demand-pull inflation. It happens in a boom, when jobs are plentiful and wages rise, or when the government spends far more than it collects.
The second is costs. When the things firms need to make their goods grow dearer, wages, fuel, raw materials, the goods themselves get dearer, even with no extra spending at all. This is cost-push inflation. Nepal buys its petrol and diesel from abroad, and much else besides, so it feels a world price quickly. In the year to mid-October 2026 the world price of crude oil rose 95%, to about $119 a barrel, and the prices of the goods Nepal imported were up about 20% on average. Nepal Rastra Bank’s report doesn’t say how much of the year’s inflation came from them, only that in the basket the cost of transport rose 13%. A hailstorm on the tomato fields, a road cut by a landslide, a blockade at the border: each is a cost pushing from the supply side.
The third is expectation. Once people expect prices to keep rising, they act in ways that make it happen. Workers ask for more pay to keep up, and firms that expect their costs to rise raise their prices first. Inflation then has a momentum of its own, which is why central banks talk so much about keeping people’s expectations steady.
The fourth is money, and it is the oldest explanation of all. In 1911 Irving Fisher wrote it down as an equation of exchange, the core of what Nepal’s Grade 11 course calls the quantity theory of money, मुद्राको परिमाणात्मक सिद्धान्त:
M is the money in the economy. V, its velocity, is how many times a year each rupee changes hands on average. P is the price level, and T is the amount of goods bought. The left side is all the money spent in a year, every rupee counted as often as it is spent. The right side is all the goods bought in that year at their prices. The two are the same spending seen from either side, so the equation is always true. Fisher’s argument was about what happens when M changes. If people spend their money about as often as before, and the economy makes about as much as before, then more money can only mean higher prices.
A made-up village shows it. The villagers have Rs. 10,000 between them, each rupee spent 5 times a year, so they spend Rs. 50,000 a year. The village makes 2,500 kilos of goods, so on average a kilo sells for Rs. 20. Now double the money to Rs. 20,000. If each rupee is still spent 5 times, and the village still makes 2,500 kilos, then Rs. 100,000 is spent on the same goods, and a kilo costs Rs. 40. Twice the money, twice the prices. The prison camp in Chapter 14 saw just this: when several hundred thousand cigarettes arrived in two weeks, prices shot up.
But the two “ifs” are big ones. In 2025/26 Nepal’s broad money grew 13.4% while its prices rose only 3.1%, and the economy’s output in rupees 6.5%. Each rupee was spent less often than the year before: the velocity of money fell by about 6%. Nepal Rastra Bank’s own study of Nepal’s prices found that when broad money grows one point faster, inflation rises by only about 0.13 of a point. Money matters most over long stretches and in great floods, when a government prints money to pay its bills and keeps printing, and then nothing else matters as much. For Nepal’s everyday prices, something else matters more.
Prices from across the border
That something is India. The Nepali rupee is fixed to the Indian rupee, Rs. 1.60 to one Indian rupee since February 1993, the border is open along its whole length, and India takes part in about two-thirds of Nepal’s trade with the world. Nepal relies on imports for much of what it eats and uses, and most of them come from India or through it. When prices rise in India, the goods Nepal buys from India cost more in Nepali rupees too, because the rupee can’t move to soften it. And with an open border, traders and shoppers carry the goods to wherever they are cheaper until prices on the two sides stay roughly in step.
They do. In October 2026 prices were up 6.09% in India and 6.37% in Nepal. Over the sixty-one years from 1965 to 2025, Nepal’s inflation averaged 7.7% a year and India’s 7.4%.
Nepal Rastra Bank measured how closely. Its study found that a rise of 1 percentage point in India’s inflation brings a rise of about 0.72 points in Nepal’s, and an IMF study had found that when the two drift apart, half the gap closes within about seven or eight months. Nepal’s inflation in any one year still has causes of its own. Prices rose fastest in the bank’s records in 1991/92, by 21%, when the rupee was devalued and the government raised the prices it sets itself, for milk, petroleum, electricity, telephones and school fees. In 2015/16 the bank pointed to political turmoil, the earthquake of April 2015 and the shortages that followed, and prices rose almost 10%, far faster than India’s. But over the years, the lines in the figure are mostly India’s line.
This changes what Nepal can do about its own prices. A country with a currency of its own controls inflation mainly through its central bank: when prices run too fast, the bank raises interest rates, borrowing becomes dearer, people and firms spend less, and the rise slows. Chapter 15 described how Nepal Rastra Bank does this, and its monetary policy for 2026/27 aims to keep inflation around 5.5%. But a central bank whose rupee is tied to India’s can only lean against the wind. The IMF’s study concluded that with the peg, Nepal’s monetary policy “can play only a limited role” in its prices over the long run. A government can also cut its own spending or raise taxes to cool demand, as Chapters 17 and 19 tell, and it can work on the supply side: better roads, more power, fewer middlemen and blockades, so that goods reach markets cheaply. Why Nepal ties its rupee to India’s at all, and what it gains and gives up, is the story of Chapter 33.
Who loses, who gains
If every price and every income rose 6% together, inflation would hardly matter: the numbers would change and nothing else. It matters because they don’t move together.
Inflation that everyone expects does the least harm. Lenders ask for interest high enough to cover it, workers bargain for it, and pensions can be set to rise with it. The damage comes from inflation that nobody expected, because the promises already made in rupees then mean less than anyone intended. Someone who saved Rs. 1 lakh in a deposit at 3.07% and then saw prices rise 6.37% has lost about 3% of what the saving can buy, without anyone taking a rupee from them. Cash under the mattress loses the full 6.37%. A lender is repaid in rupees worth less than the ones lent, and the borrower gains in exactly the same measure, which is why inflation is gentle on a farmer with a loan on his land and hard on his creditor. People living on a fixed sum lose: a pension set in rupees, a rent fixed for five years, a salary that rises only once in a few years. Inflation moves wealth from one group to another, and no law was passed to do it.
There is a quieter cost. Prices are how a market passes messages: a rise in the price of tomatoes says that tomatoes are scarce, and farmers should grow more. When every price is rising, it is hard to tell a tomato shortage from the general rise, and the message is lost in the noise. When Israel’s prices rose about 500% in 1985, shops stopped putting prices on their goods at all, since they would soon be wrong. Planning for years ahead, a loan, a pension, a business, becomes guesswork.
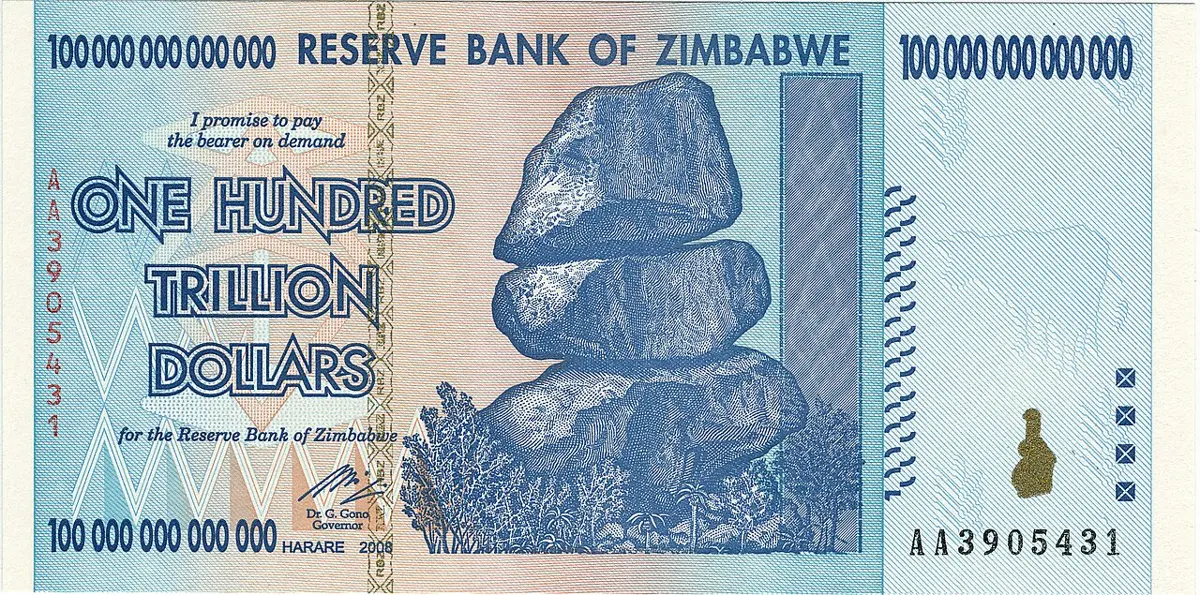
At the far end of that road is hyperinflation, prices rising so fast that money stops being money. In 2008 Zimbabwe’s prices rose by something like 500 billion percent in a year. Its central bank printed notes of 100 trillion Zimbabwe dollars, and in the end the country gave up its own currency. This is Fisher’s equation with its brakes off, M growing without limit.
When prices fall
It might seem that the opposite, prices that fall, would be a gift. Sometimes it is: when a crop is good or a new machine makes a good cheaper, prices fall because more can be made for less. But a fall in the whole price level, kept up over time, usually comes with an economy that is shrinking, and it has a trap of its own.
Irving Fisher explained it in 1933, in the depths of America’s Great Depression. Farmers and firms had borrowed heavily in the good years. When the slump came they sold what they could to pay their debts, and the selling drove prices down. As prices fell, every rupee, or dollar, of debt became harder to pay, because the crops and goods that had to be sold to pay it fetched less. By March 1933, Fisher reckoned, Americans had paid off about a fifth of what they owed, but the dollar had grown about 75% dearer, so the debt left was heavier than before, by about 40% in goods. “The more the debtors pay,” he wrote, “the more they owe.” His way out was to raise prices again.
Deflation also gives everyone a reason to wait. A buyer who expects a motorbike to be cheaper next year buys it next year, so this year sellers sell less, make less and employ fewer people. Japan had prices that fell a little year after year from 1999 to 2005, and again from 2009 to 2012, and its economy barely grew. The IMF blames that largely on the deflation. The Bank of Japan’s own governor argued the other way round in 2011: an economy whose power to grow had been sinking for years was the deeper cause, and the falling prices were a sign of it. By the World Bank’s yearly figures, Nepal hasn’t had a year of falling prices since 1976. Why whole economies sink into slumps, and how governments pull them out, is the next chapter.
So Nepal Rastra Bank aims not for zero inflation but for a little, steady and expected, far from the trap of falling prices and too little to blur what prices are saying. Inflation is the rise in the price of a whole basket, and how much it hurts depends on whose basket it is, who expected it, and who owes whom. In Nepal much of it arrives across the border, a few months after it starts in India, and the rupee’s peg means the country’s own tools can do little more than lean against it. Real gains are only what is left after prices have taken their share, which is why the price index sits beside every other number on the dashboard.
Found a mistake? Please tell us.