
For most of the last thousand years, an ordinary family lived about as well as its great-grandparents had. The best estimates put England’s income a head in the year 1000 at about 1,150 of today’s dollars, and in 1300, three centuries later, still about 1,160. China’s was about 1,200 in 1000 and lower, under 900, in 1820. Harvests came and went, wars and plagues took people away and peace brought them back, but the line of income across the centuries ran nearly flat. Then, in a few places, it turned upward, and it has not stopped since.
The long flat line
In 1820 the world’s 1 billion people had about $1,130 a head to live on, counted at 2011 prices. By 2022 there were 7.8 billion people with about $16,700 each. The world had about seven and a half times as many people and almost fifteen times as much for each of them. Drawn on a graph, the line looks like a hockey stick: a long, flat handle, then a sharp turn up at the end.
The turn came first in Britain. Its line was creeping up by the late 1600s and climbed faster from the middle of the 1700s, as spinning machines and steam engines came into its workshops and mills, and by 2022 an average Briton had about sixteen times the income of one in 1700. Other countries followed, at different times, and some are still waiting. Economists who study the turn give the same causes again and again: new technology that kept on coming, people specializing in narrower and narrower jobs, and machines, buildings and roads piling up, which is what economists mean by capital.
These figures come from a project begun by the British economist Angus Maddison and carried on since his death in 2010 at the University of Groningen in the Netherlands, which gathers historians’ estimates of what each country produced, as far back as the evidence goes. The dollars in it are not ordinary dollars. Each country’s output has been turned into dollars at purchasing power parities, rates worked out so that a dollar buys the same basket of things in every country. A haircut or a plate of dal bhat is far cheaper in Nepal than in New York, so a rupee buys more at home than its exchange rate suggests. Counted this way, in dollars of 2011, Nepal’s output in 2022 comes to about $3,000 a head, about twice the $1,513 that Chapter 13 gave for 2025/26, which turned rupees into dollars at the bank’s rate. Neither number is wrong. They answer different questions: what Nepal’s output would buy at home, and what it would buy abroad.
In 1950 four of these countries were almost exactly as poor as each other. An average person in Nepal had about $800 a year, in China about $800, in India and South Korea about $1,000. By 2022 Nepal’s figure was about $3,000, India’s $7,800, China’s $19,200 and Korea’s $41,300. Before 1950 the record for Nepal is thin: the database has only three numbers, for 1820, 1870 and 1913, without saying what they rest on, so the graph shows them as dots rather than a line, and they should be read as rough guesses. For India and China it shows something sadder. An average person in both was poorer in 1950 than in 1600.
Two percent and seven percent
It is tempting to think Nepal stood still while Korea raced ahead. It didn’t. From 1950 to 2022, Nepal’s income a head grew by about 1.9% a year, almost exactly the pace of the United States over the same years, and since 2000 a little faster, about 2.7%. Nepalis in 2022 had nearly four times the income of their grandparents in 1950, the same multiple as Americans. The difference is where they started: in 1950 an American already had about nineteen times as much as a Nepali, and growing at the same pace keeps America about nineteen times richer, while the gap in dollars keeps widening.
Korea did something else. From 1960 to 2000 its income a head grew by about 7% a year, year after year, for forty years. The difference between 2% and 7% sounds small. It isn’t, because growth compounds. Each year’s growth is added to a bigger total than the year before, exactly as interest on interest makes savings grow in Money, for the Curious. Money Chapter 10’s shortcut works here too: divide 72 by the growth rate for about how many years it takes to double. At 2% a year income doubles in about 35 years, roughly once in a working life; at 7%, in about 10. After 20 years, 2% growth has made a country about one and a half times as rich, and 7% almost four times. After 50 years the gap is enormous: 2.7 times as rich against 29 times. A country growing at 7% a year turns from poor to comfortable within the memory of one family, and that is what people in Korea saw. How it managed it, and why economists still argue about the reasons, belongs to Chapter 20.
The same arithmetic gives the size of the task in front of Nepal. To reach Korea’s income of 2022 from where it stood that year, Nepal would need about 132 years at 2% a year, and about 39 years at 7%. One is the lifetime of a great-grandchild; the other is the working life of a student now in school.
These are rates for income a head. Chapter 13’s growth of 3.85% in 2025/26 was for the whole of GDP, and while the number of people is rising, part of that only keeps each person’s share where it was, so growth a head is lower.
Growth is not development
Nepal’s textbooks draw a line between two words that are easy to mix up. Economic growth, आर्थिक वृद्धि, is a rise in what a country can produce: more output, more income, measured by GDP, GNP and income a head. It is a matter of quantity. Economic development, आर्थिक विकास, is growth and more: people living longer and healthier lives, more children in school and learning there, fewer people poor, a fairer share of what is made, more people with work. The development economist Michael Todaro described it as a growing economy that is also reducing poverty, inequality and unemployment. Growth can happen without development, if the extra income goes to a few, or into weapons, or out of the country. Development is hard to imagine without some growth, because schools, clinics and roads have to be paid for.
Countries still on the way, called developing countries, विकासशील राष्ट्र, tend to share a set of features, and Nepal shows most of them. Income a head is low: Nepal’s $3,000 against the world’s $16,700. About a quarter of what Nepal makes still comes from farming, forests and fishing. Most work is informal, in family farms and shops and jobs without contracts, about 85% of it in Nepal’s labor survey of 2017/18. Adults have had only about four and a half years of school on average, and many families depend on money sent from abroad, which in Nepal adds about a third to what the country makes at home (Chapter 13 has those figures). None of these is a fixed fate: Korea, now rich, was about as poor as Nepal in 1950.
So how do you measure development, if not by income alone? The first answer is still income a head, GDP or GNI divided by the number of people. It is easy to count and to compare, and it goes with most good things. But it is an average, and an average can hide a great deal. It says nothing about who gets the income, how long people live, whether they can read, or whether the growth is cutting down the forest that the next generation needs.
In the 1970s economists tried other measures. In 1976 the International Labour Organization’s World Employment Conference put forward the basic needs approach: development means first that everyone has enough food, shelter and clothing, and then clean water, sanitation, health care and schooling. Around the same time an American economist, Morris David Morris, working for the Overseas Development Council in Washington, made a Physical Quality of Life Index, set out in his book of 1979, from three numbers that ordinary statistics could give: how many people can read, how many babies die before their first birthday, and how long a one-year-old can expect to live. Each was turned into a score from 0 to 100 and the three averaged. It caught something income missed: some countries with modest incomes kept their people alive and taught them to read far better than others much richer.
The measure that lasted came in 1990. Mahbub ul Haq, a Pakistani economist who had been his country’s finance minister, led the work at the United Nations Development Programme (UNDP) that began a yearly Human Development Report. Its first chapter opens: “People are the real wealth of a nation.” The idea behind it came largely from the Indian economist Amartya Sen: what matters is not the income itself but what people are able to do and be, to live long, to know things, to have a decent standard of living. Income is a means to those ends, not the end.
Its Human Development Index, or HDI, मानव विकास सूचकाङ्क, measures those three things with four numbers. Health is life expectancy at birth. Knowledge is two numbers: how many years of school a child starting now can expect, and how many years adults aged 25 and over have actually had. Living standard is GNI a head, at purchasing power parities. Each is placed on a scale from 0 to 1 between a low and a high goalpost: life expectancy between 20 and 85 years, expected schooling between 0 and 18 years, actual schooling between 0 and 15, income between $100 and $75,000 a head. Income goes in as its logarithm, because an extra thousand dollars matters far more to a family with two thousand than to one with fifty. The two schooling scores are averaged, and the three scores are combined by their geometric mean (multiply them and take the cube root), so a country can’t make up for a very low score in one by a high one in another.
For Nepal, the 2025 report, which gives figures for 2023, has life expectancy of 70.4 years, 13.8 years of expected schooling, 4.5 years of schooling for adults, and GNI of $4,726 a head (at 2021 prices). The health score comes out at about 0.77, income at about 0.58, and education, pulled down by the adults who never went to school or left early, at about 0.53. Together they make an HDI of 0.622, 145th of 193 countries. UNDP calls a value from 0.550 to 0.699 medium human development, so Nepal’s is medium; high begins at 0.700 and very high at 0.800. In 1990 its HDI was 0.404, in the lowest fifth of the countries with figures for that year: since then life expectancy has risen from about 55 to about 70, and a child’s expected schooling has nearly doubled.
The HDI earns its place when two countries have the same income and very different lives. Sri Lanka and Equatorial Guinea had almost the same GNI a head in 2023, about $12,600 and $12,800. Sri Lankans could expect to live to about 77 and a half, people in Equatorial Guinea to about 64. Sri Lanka’s HDI was 0.776, 89th in the world; Equatorial Guinea’s was 0.674, 133rd. The report even prints a column for this: a country’s place by income minus its place by HDI. Nepal’s is +10: it does a little better on health and schooling than its income would predict. Sri Lanka’s is +22, Equatorial Guinea’s −24.
What the averages hide
The HDI is still a set of averages. A country where half the people live to 90 and half to 50 has the same life expectancy as one where everyone lives to 70. So the report also gives an inequality-adjusted HDI, which marks a country down for how unevenly each of the three things is shared. In a country where everyone had the same, the two numbers would be equal. Nepal’s HDI of 0.622 falls to 0.437 once inequality is counted, a loss of almost 30%. Most of the loss is in schooling, which is shared out more unequally than health or income: the education score loses about 40%, income about 32%, health about 15%.
Nepal’s own Human Development Report, the sixth, made by the National Planning Commission with UNDP and published in 2020, worked out the HDI inside the country for 2019, with its own figures. For the whole country it gave 0.587. Bagmati Province came highest at 0.661, then Gandaki at 0.618; Karnali had 0.538, and the province now called Madhesh, then still Province 2, the lowest at 0.510. Towns had 0.647 and villages 0.561; the hills scored higher than either the mountains or the Tarai. Bagmati’s figure is almost a third higher than Madhesh’s, and a single number for Nepal hides that.
Even the best index leaves things out. The HDI counts years in school, not what children learned there. It doesn’t count the air people breathe, whether they can speak freely, or whether the income is being earned by using up forests and rivers that can’t be replaced. Every measure is a choice about what to count, and each one shows something the others miss.
Why the old economists expected it to stop
The first economists lived just as the hockey stick began to bend, and most of them didn’t think the bend would last. Nepal’s textbooks group them as the classical economists, the British and French writers from the late 1700s to the middle 1800s: Adam Smith, David Ricardo, Thomas Malthus, Jean-Baptiste Say and John Stuart Mill. They mostly agreed on a few things. Governments should leave markets alone, the policy called laissez-faire. A country grows by saving and investing, which piles up capital; as Smith put it in 1776, “Capitals are increased by parsimony, and diminished by prodigality and misconduct.” Profit is what makes people invest. And growth would one day come to rest in what they called the stationary state, स्थिर अवस्था, an economy that no longer grows.
Smith knew a stationary economy when he saw one. China, he wrote, had long been one of the richest countries in the world, but “It seems, however, to have been long stationary”: travelers of his day described it much as a Venetian traveler had five hundred years before. Where an economy grows, wages rise and life is good; “The progressive state is, in reality, the cheerful and the hearty state to all the different orders of the society; the stationary is dull; the declining melancholy.”
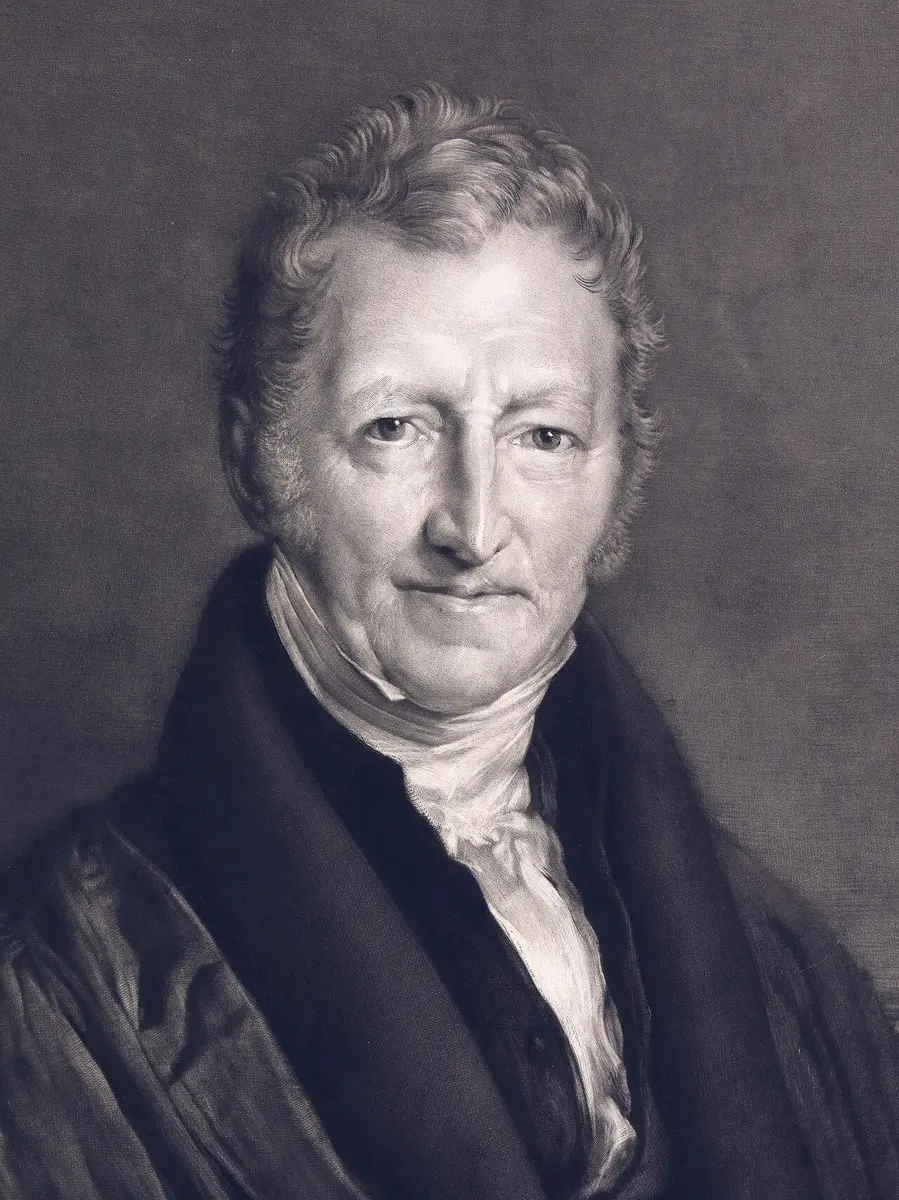
Thomas Robert Malthus, an English clergyman, gave the gloomiest reason why growth must stop. His Essay on the Principle of Population, printed in London in 1798, began from a conversation with a friend and rested on two things he took as given: “First, That food is necessary to the existence of man. Secondly, That the passion between the sexes is necessary and will remain nearly in its present state.” From these he drew his famous rule: “Population, when unchecked, increases in a geometrical ratio. Subsistence increases only in an arithmetical ratio.” A geometrical ratio doubles and doubles again, 1, 2, 4, 8; an arithmetical one only adds the same amount, 1, 2, 3, 4. He took Britain, then about 7 million people, and let its numbers double every 25 years while its food grew by the same amount each 25 years. After a century there would be 112 million people and food for 35 million, leaving 77 million with nothing. Long before that, something would cut the people back to what the land could feed: hunger, disease, war, or people putting off marriage for fear of not being able to feed a family. If all else failed, he wrote, “gigantic inevitable famine stalks in the rear, and with one mighty blow levels the population with the food of the world.” Any gain in income would be eaten up by more mouths, and most people would be held near the edge of survival for ever.
David Ricardo, a Londoner who made a fortune on the stock exchange, much of it in government loans, and then turned to economics, gave a second reason. As people multiply, farming has to move onto poorer land, so each extra sack of grain takes more work, food grows dearer, and wages must rise just to keep workers fed. Profits are squeezed. “The natural tendency of profits then is to fall,” he wrote, and once they fell low enough there would be no reason to invest, and growth would stop. But he added a sentence that turned out to matter more than his rule: this tendency, he wrote, “is happily checked at repeated intervals by the improvements in machinery, connected with the production of necessaries, as well as by discoveries in the science of agriculture.” John Stuart Mill, writing in 1848, was the odd one out. He could not regard the stationary state, he wrote, “with the unaffected aversion so generally manifested towards it by political economists of the old school”, because “a stationary condition of capital and population implies no stationary state of human improvement.” A country could stop growing richer and still grow wiser and kinder.
Malthus was right about the past. For most of history the line was flat because every gain was spread over more people. He was wrong about what came next, and the world’s numbers show it: from 1820 to 2022 the number of people grew about seven and a half times, and the income for each of them almost fifteen times. What Ricardo called a check “at repeated intervals” became continuous. New machines, new crops, new fertilizers and new ways of working arrived faster than people multiplied. And as incomes rose, families almost everywhere came to have fewer children: the world’s women have about 2.3 each on average today, against 3.3 in 1990. Why exactly is still argued. Whether the planet can keep up with more people living better is a real question, but a different one from Malthus’s, and the Going Further topic How Many People Can the Earth Support? takes it up.
For almost all of history the economy grew so slowly that nobody could see it in a lifetime, and then, in a few countries and then in more, growth of a few percent a year became normal. What matters is not whether a country grows a little, but whether it keeps growing for decades, because the difference between 2% and 7% is the difference between a doubling in a lifetime and a doubling every ten years. But income was never the point. People want to live long, to learn, to choose their lives, and a country is developing only when growth turns into those things for most of its people, not just for its average.
Found a mistake? Please tell us.