
Two TV channels show the evening news, and both talk about tomatoes. On the first, a red bar shoots up above a little blue one, and the presenter says “Tomato prices shoot up!” On the second, the two bars stand side by side, nearly the same height, and nobody mentions tomatoes at all.
Both channels used the same two numbers: tomatoes cost Rs 82 a kilogram last week and Rs 88 this week (our own numbers, not a real market’s). Neither changed a number. So how can one graph show a crisis and the other show nothing? Try it before reading on: below is the first channel’s chart, and you control where its axis starts.
Guess first: by how much did the price of tomatoes really rise?
Pick an answer to see why.
Where does the axis start?
Here is what happens to the two bars as the bottom of the axis moves up. Every row shows the same two prices.
| The axis starts at | Last week’s bar | This week’s bar | This week’s bar is |
|---|---|---|---|
| Rs 0 | 82 | 88 | 1.07 times as tall |
| Rs 40 | 42 | 48 | 1.14 times |
| Rs 60 | 22 | 28 | 1.27 times |
| Rs 70 | 12 | 18 | 1.5 times |
| Rs 76 | 6 | 12 | 2 times |
| Rs 79 | 3 | 9 | 3 times |
| Rs 81 | 1 | 7 | 7 times |
Look at the two bar columns. Moving the axis up cuts the same piece off both bars, so the gap between them stays 6. But the shorter bar gets shorter and shorter, and the gap of 6 becomes huge compared with what is left of it.
That is how to solve the puzzle without trying. For this week’s bar to be twice last week’s, the gap of 6 must be as big as all that is left of last week’s bar: so only 6 may be left, and the axis must start at 82 − 6 = Rs 76. For three times, the gap must be twice what is left: 3 left, so the axis starts at Rs 79.
Where must the axis start for this week’s bar to look four times as tall as last week’s?
Pick an answer to see why.
And if the axis started at Rs 82 itself? Last week’s bar would vanish altogether, and no number of times, however big, could say how much taller this week’s is. No chart does that, but some come close.
The lie factor
Why do our eyes fall for it? Because we read a bar chart by comparing the bars, not the numbers on the axis. Long before you have read the small numbers on the side, you have seen that one bar is much taller than the other. A bar chart says “this is how much” with the length of each bar, so the length must be in proportion to the number.
The statistician Edward Tufte gave a way to measure how much a chart exaggerates. Take the change as a fraction of the first value, once in the data and once in the drawing:
- In the data, the price rose by 6 out of 82.
- In the drawing with the axis at Rs 76, the bar rose by 6 out of 6: it doubled.
Tufte’s lie factor is the change shown in the drawing divided by the change in the data:
An honest chart has a lie factor of 1: its pictures change by the same fraction as its numbers. This one makes the rise look 13.7 times as big as it really is. Tufte said a chart is badly off once its lie factor is above 1.05 or below 0.95.
A rule you can prove
Look at the fraction once more. Whatever the axis start, the change is 6 in both the drawing and the data (both bars lose the same piece, so the gap stays 6). The 6s cancel, and what is left is
That is: the whole of the shorter bar, divided by the part of it you still see. Cut away half of last week’s bar and every change looks 2 times as big; cut away three quarters and it looks 4 times as big; leave a fortieth and it looks 40 times as big. The rule doesn’t even depend on this week’s price: whatever the second number, cutting the bottom off the chart exaggerates the change from last week’s price by the same factor.
So the rule for bar charts is short: a bar chart’s axis starts at zero. Two scientists who made a course on spotting bad data, Carl Bergstrom and Jevin West, call it the principle of proportional ink: when a shaded area stands for a number, the area should be in proportion to the number.
A real one
In July 2012, a US business channel, Fox Business, showed what would happen to the top rate of income tax in the United States if some tax cuts ended: from 35% now to 39.6% on 1 January 2013. Its chart’s axis went from 34% to 42%, just as the widget below starts.
Pictures that grow both ways
Some charts use pictures instead of bars: a coin for money, a sack for rice, a house for houses sold. To show twice as much, the artist draws the picture twice as big. But twice as big which way?
The eye judges a flat picture by its area and a picture of a solid by its volume. So a coin drawn twice as wide shows a change from 1 to 4 for a number that went from 1 to 2: in the data the change is 1 out of 1, in the picture 3 out of 1, a lie factor of 3. The box, from 1 to 8, has a lie factor of 7. The journalist Darrell Huff warned about this trick in 1954, in his book How to Lie with Statistics: a number has only one dimension, its size, but a picture has two or three.
A drawing should show that a farm’s harvest grew to 1.5 times last year’s, using a picture of a sack. If the new sack is drawn 1.5 times as wide and 1.5 times as tall, how big does it look?
Pick an answer to see why.
Choose the years, choose the axis
The axis and the pictures are two tricks. A third is the choice of what to show. Here is a real record: Earth’s average temperature every year from 1880 to 2025, as measured by NASA, the US space agency. Nothing in it is made up. Try making it say three different things.
Choosing only the stretch of data that supports your story is called cherry-picking, like picking only the ripe cherries off a tree and saying the tree has no green ones. Its favorite move is visible in the widget: start at an unusual point. A record-hot year, a month when sales were very low, the day before a festival: whatever you compare with an unusual start looks like a change.
The axis can be stretched too. A line graph drawn tall and narrow makes a gentle slope look like a cliff; drawn short and wide, a cliff looks gentle. A chart with two axes, one on each side for two different things, is easier still to bend: a data journalist at The Economist found one of its own charts where a dog’s weight and its neck size seemed to fall together, line on line. But the left axis went from 21 down to 18 (a fall of 14%) and the right one from 45 down to 42 (a fall of 7%).
When zero is the wrong place to start
You might now think: always start every axis at zero. Here is where that rule breaks.
Press the second axis button in the widget again. That chart, with its axis from −20 to 40 °C, copies a real one. In December 2015 a US magazine, National Review, posted a chart of Earth’s average temperature since 1880 on an axis running from −10 °F (about −23 °C) up to 100 °F (about 38 °C; some reports say 110 °F), and called it “The only #climatechange chart you need to see.” On it, the warming looked like a flat line. Its axis was far from cut off. It was too tall.
The trouble is that the axis no longer showed the size of a change that matters. In all 146 years of the record, the whole Earth’s coldest year (1909) and its warmest (2024) are only 1.76 °C apart, so for this record a change of one degree is huge, even though it is tiny next to the difference between a winter morning and a summer afternoon. Zero degrees Celsius isn’t “no temperature” either: it is only where water freezes.
Your body works the same way. A child’s temperature rising from 37 °C to 39.6 °C is a real fever: a rise of 2.6 degrees, 7% of 37. On an axis from 0 °C (Figure 27.2, top) it takes up only 6.5% of the height and looks like nothing at all. On an axis from 36 °C (bottom) it takes up 65% and anyone can see it. For a line graph the bottom of the axis isn’t the length of anything, and the lie factor doesn’t apply: what matters is that the range shows the changes that matter, and that its numbers are written clearly enough to read. One designer’s rule of thumb, quoted by The Economist: when a line chart doesn’t start at zero, leave at least a third of the chart empty below the line, so it doesn’t look like a fall to nothing.
So the full rule has two halves:
- Bars, areas and pictures: the length or area is the number, so start at zero and grow one way only.
- Lines and dots: the position shows the number, so choose a range that shows the changes that matter, label it, and show enough of the data that the start isn’t a cherry-pick.
Where this is used
Questions
★ A bar chart’s axis starts at 50. One bar stands for 60 and the other for 70. How many times as tall does the second bar look?
Pick an answer to see why.
What is the lie factor of the chart in the question above? Use the rule: the whole of the shorter bar divided by the part you see.
Answer
A tea shop’s poster shows its customers as cups: 100 customers is a cup 2 cm tall, and 300 customers is a cup 6 cm tall and three times as wide. How many times as big does the second cup look? How tall and wide should it be drawn to be honest?
Answer
A museum’s report shows a line of “visitors since we opened”, which climbs every month: 1,200 after the first month, then 2,300, 3,250 and 4,050. The director says visitors are growing. What were the visitors in each month, and is the director right?
Answer
In The Economist’s chart of dogs, the left axis ran from 21 kg down to 18 kg, and the right one from 45 cm down to 42 cm, drawn the same height. Both lines fell from top to bottom. Did weight and neck size fall by the same fraction?
Answer
Here are five years of a town’s population (made-up numbers): 2000: 10,000; 2010: 12,000; 2020: 14,000; 2022: 14,400; 2024: 14,800. A chart puts the five years at equal spaces along the bottom. What does it make the last few years look like, and why?
Answer
On the tomato chart, explain why the lie factor of a cut-off bar chart doesn’t depend on the second number at all. Would it be the same if this week’s price had been Rs 100?
Answer
★★★ A chart shows the average temperatures of two months as bars, one for 10 °C and one for 20 °C, with the axis from 0 °C. Is the second month “twice as hot”?
Pick an answer to see why.
Where to go next
- What Does an Average Hide? One number for a whole class, and the many shapes of data that give the same average.
- How Much Rice Does Nepal Eat in a Day? Estimating a big number from a few you know, and checking whether it is roughly right.
- Can a Treatment Win in Every Group but Lose Overall? (Grades 9–12) Data that tells opposite stories depending on how you group it.
- Does Ice Cream Cause Drowning? (Grades 9–12) Two lines that rise together, and why that isn’t proof that one causes the other.
- Charts that tell the truth (Grade 6 Computing) A chart’s title, axes and numbers, and why bars start at 0. Grade 8 Computing designs charts both ways in Charts: the same data, different stories.
Where these facts come from
- The lie factor (size of effect shown in the graphic ÷ size of effect in the data, an effect being the change divided by the first value; 1 for an accurate graph): Wikipedia, “Misleading graph”, read October 2026, which also supported Huff’s “no adjectives or adverbs to spoil the illusion of objectivity” (How to Lie with Statistics, 1954, p. 63), pictures whose area or volume is read instead of their height, and the research finding that people overestimate differences in truncated charts even when told; Tufte’s threshold of 0.95 to 1.05: A. Joshi, “Graphical Integrity”, lecture slides after Tufte, University of San Francisco, read October 2026.
- Tufte’s fuel economy example (18 to 27.5 miles per gallon, 0.6 to 5.3 for the drawn lines, 53% and 783%, lie factor 14.8; The Visual Display of Quantitative Information, p. 57): “Computing Lie Factor by Dividing Percentages”, forum thread on Edward Tufte’s site, and the Joshi slides above, which reproduce Tufte’s annotated copy of the graphic (New York Times, 9 August 1978, p. D-2, “Set by Congress and supplemented by the Transportation Department”), read October 2026.
- The principle of proportional ink (the shaded area in proportion to the value; bar charts start at zero, line charts needn’t include zero), from Tufte (1983): C. Bergstrom and J. West, “The principle of proportional ink”, Calling Bullshit, read October 2026.
- The Fox Business chart (31 July 2012; the top rate from 35% to 39.6%, 4.6 points; “a badly distorted scale”): Media Matters, “Dishonest Fox Chart: Bush Tax Cut Edition”, read October 2026; the chart itself, with its axis from 34% to 42%, as shown in J. Leek, “The statisticians at Fox News use classic and novel graphical techniques to lead with data”, Simply Statistics, 26 November 2012 (the image from N. Robbins in Forbes, opened through the Internet Archive), read October 2026.
- Earth’s temperature, 1880–2025 (yearly differences from the 1951–1980 average): NASA GISS, GISTEMP v4, global land–ocean means, downloaded October 2026 (as of 2026: later versions may change the numbers slightly); the level of about 14 °C, uncertain by about 0.5 °C, while the yearly differences are known to about 0.06 °C: NASA GISS, “The Elusive Absolute Surface Air Temperature”, read October 2026.
- The National Review chart (December 2015, “The only #climatechange chart you need to see”, the chart from the blog Power Line): E. Foehringer Merchant, The New Republic, 14 December 2015; its axis from −10 °F to 100 °F and the years from 1880: L. O’Connor, HuffPost, 15 December 2015, both read October 2026; other reports give the top of the axis as 110 °F (not confirmed in a source we opened).
- A fever in a child from 38 °C (taken in the bottom), and a call to a doctor for an adult whose fever keeps rising above 39.4 °C: MedlinePlus, “Fever”, read October 2026.
- The Economist’s 40 charts a week, the cut-off bar chart, the dog chart (21 to 18 and 45 to 42), and the rule of thumb of a third left empty under a line chart that doesn’t start at zero (from Francis Gagnon): S. Leo, “Mistakes, we’ve drawn a few”, 27 March 2019, read October 2026 (through the Internet Archive).
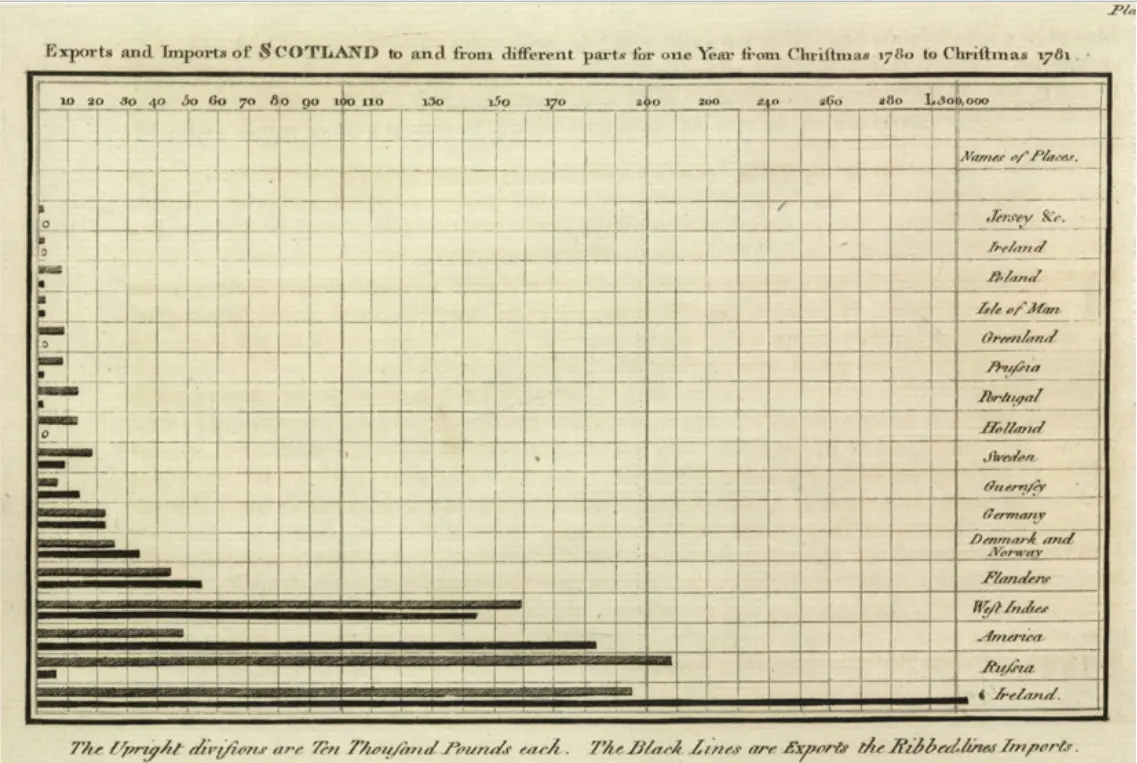
- William Playfair (1759–1823), line and bar charts in the Commercial and Political Atlas (1786), the bar chart because he lacked a series of years for Scotland, pie charts in the Statistical Breviary (1801), and the earlier bars of Oresme (14th century) and Priestley’s timelines (1765): Wikipedia, “William Playfair”, read October 2026.
- Huff’s book (1954), a journalist, not a statistician, over one and a half million copies in English: Wikipedia, “How to Lie with Statistics”, read October 2026; the title of its Chapter 5, “The Gee-Whiz Graph”, read in a teacher’s copy of the chapter, October 2026.
- Every other number (the tomato table, the axis starts for 2, 3 and 4 times, every lie factor, the pictures’ areas and volumes, the temperature changes and years, the fever’s share of each axis, the questions’ answers) was computed by a program of our own.