
In Ludo you need a six to bring a token out. Ishwori has rolled eight times without one, while her cousin has three tokens out already. “The die hates sixes,” she says. Is a six really rarer than a three? Is she just unlucky? And can a number say how likely something is?
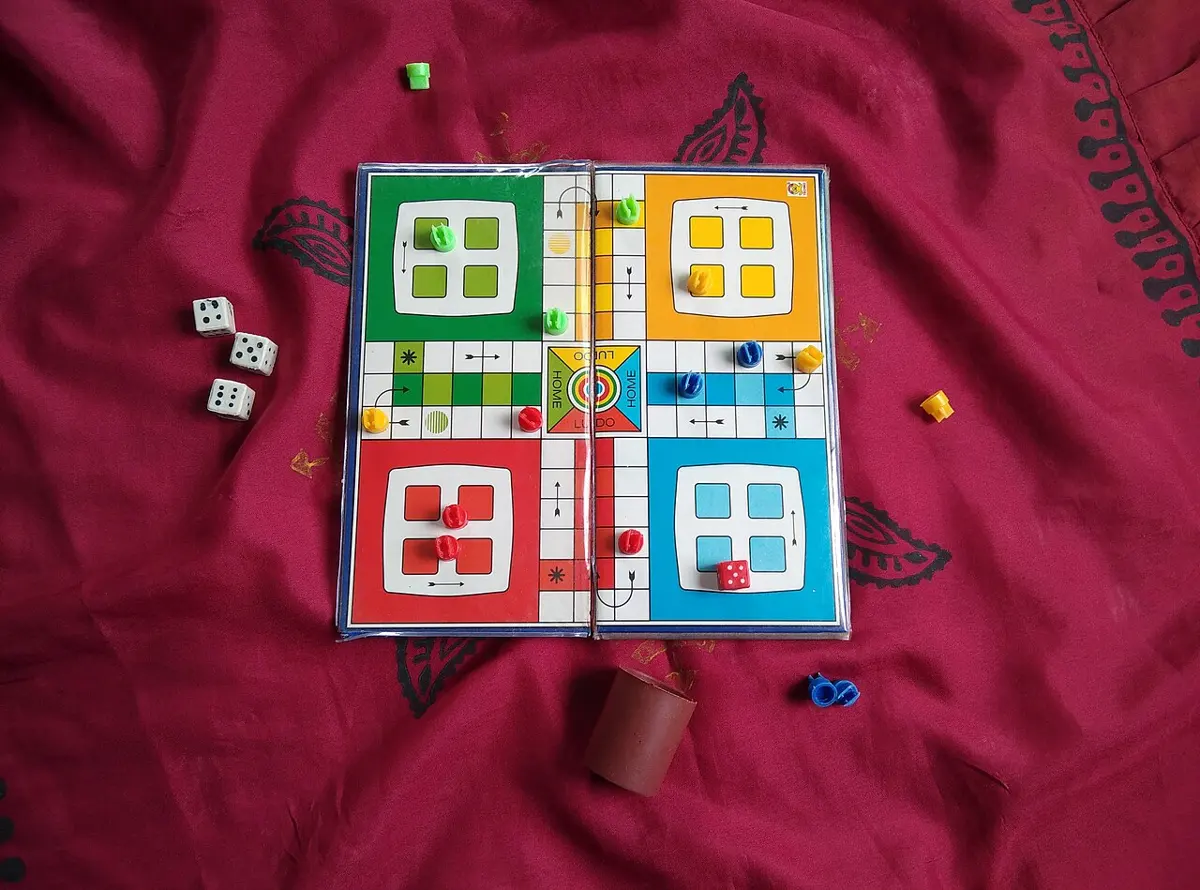
This unit puts a number on chance. You will list everything that can happen, count the ways an event can happen, and find its probability, a number from 0 to 1. Then you will roll a die hundreds of times on the page and see whether experiments agree with counting. In Back to Ludo you can answer Ishwori.
19.0 Review
Read these sentences:
- a.The sky is cloudy today; perhaps it will rain.
- b.I am not sure whether I will pass the exam.
- c.The political situation may change suddenly.
- d.The two candidates have an equal chance of winning the election.
- e.Which country is most likely to win the next football World Cup?
Words such as perhaps, not sure, may, chance and likely show uncertainty: the thing may happen, or it may not. We still guess, from what has happened before. Clouds have often brought rain, so we carry an umbrella. People have made such guesses about daily life since ancient times. Probability turns the guess into a number.
Which of these is certain to happen?
Pick an answer to see why.
19.1 Probability
The measure of how likely an event is to happen is called its probability. Clouds don’t make rain certain; they make it likely, and probability says how likely, as a number.
Some words of probability
These two examples give us the words we need.
a. Experiment. An action done to see what result it gives: tossing a coin, rolling a die, drawing a card.
b. Random experiment. An experiment whose result can’t be predicted with certainty, although we know every result it could give. Tossing a coin, rolling a die and drawing a lottery are random experiments: nobody can say beforehand who will win the lottery.
c. Outcome. One possible result of a random experiment. When a coin is tossed, H is one outcome and T is the other.
d. Equally likely outcomes. Outcomes that each have the same chance of happening. On the left spinner below, the four colors cover equal areas, so the pointer is as likely to stop on one color as on any other: the four outcomes are equally likely. On the right spinner the colors cover unequal areas, and green, half the board, comes up far more often than red: those outcomes are not equally likely.
e. Sample space. The set of all possible outcomes of a random experiment, written S. For a coin, S = {H, T} and n(S) = 2. For a die, S = {1, 2, 3, 4, 5, 6} and n(S) = 6.
f. Event. A set of some of the outcomes, so a subset of the sample space, usually written E. For a coin the events are {} (neither face, which can’t happen), {H}, {T} and {H, T} (one face or the other, which always happens). An event “happens” when the outcome is one of its members.
g. Mutually exclusive events. Toss a coin and suppose it shows T. Was H showing at the same time? No. Toss it again; it shows H. Could T show too? No. Events that can’t happen at the same time are mutually exclusive: if one happens, the other can’t. Getting H and getting T are mutually exclusive. So are the six faces of a die: one roll shows only one face.
h. Number of favorable outcomes. The number of outcomes that make an event happen, n(E). For “an even number” on a die, the favorable outcomes are 2, 4 and 6, so n(E) = 3.
i. Elementary event. An event with just one outcome. Rolling a die, the elementary events are {1}, {2}, {3}, {4}, {5} and {6}.
A die is rolled. Which two events are mutually exclusive?
Pick an answer to see why.
The probability of an event
The possible outcomes are S = {H, T}, so n(S) = 2. Getting a head is the event E = {H}, with one favorable outcome, n(E) = 1. One outcome out of two equally likely ones: the probability of a head is , and so is the probability of a tail.
When all the outcomes of an experiment are equally likely, the probability of an event E is
that is, the number of favorable outcomes divided by the number of all possible outcomes. For a head, .
The rule needs the outcomes to be equally likely. On the unequal spinner above there are 4 colors, but the probability of green is not : it is , its share of the board. A fair coin, a well-made die, a well-shuffled pack of cards and balls of the same size in a bag drawn without looking all give equally likely outcomes.
The event “not E”, written E and read “E bar”, is every outcome that is not in E: its complement. The outcomes in E and in E together make up all of S, so n(E) + n(E) = n(S). Dividing by n(S):
A pack of playing cards (तास) has 52 cards in four suits of 13: spades (हुकुम) and clubs (चिडी) are black; hearts (पान) and diamonds (इँटा) are red. Each suit has an ace, the numbers 2 to 10, and three face cards, the jack (गुलाम), queen (रानी) and king (बादशाह); the ace is the एक्का. So a pack has 26 red and 26 black cards, 4 aces, 4 kings and 12 face cards.
| Suit | Color | Cards in the suit |
|---|---|---|
| Spades ♠ | black | A, 2–10, J, Q, K: 13 |
| Clubs ♣ | black | 13 |
| Hearts ♥ | red | 13 |
| Diamonds ♦ | red | 13 |
A bag has 3 red, 4 blue and 5 white balls of the same size. One is drawn without looking. What is the probability that it is blue?
Pick an answer to see why.
Exercise 19.1
Question 1
Write the sample space of each experiment.
A die is rolled once.
Answer
A coin is tossed twice.
Answer
A day of the week is chosen.
Answer
The spinner below is spun, and the color the pointer stops on is noted.
Answer
Question 2
Write the event (the favorable outcomes) in each case.
An even number when a die is rolled once.
Answer
Two heads when a coin is tossed twice.
Answer
An odd-numbered day, when the days of a week are numbered 1 to 7 and one is chosen.
Answer
One head and one tail when two coins are tossed together.
Answer
Question 3
Find the probability of getting a prime number when a die is rolled.
Answer
Question 4
Two coins are tossed together. Find the probability of one head and one tail.
Answer
Question 5
A family is picked at random from these.
| Children in the family | 0 | 1 | 2 | 3 |
|---|---|---|---|---|
| Families | 9 | 15 | 36 | 30 |
There are 9 + 15 + 36 + 30 = 90 families, so n(S) = 90.
Find the probability that the family has no children.
Answer
Find the probability that the family has 2 children.
Answer
Find the probability that the family has at least 2 children.
Answer
Question 6
Work in four groups. Each group takes a well-shuffled pack of 52 cards and counts the cards of each kind to fill these tables.
- a.♣, ♦, ♥ and ♠ cards
- b.aces (A), jacks (J), queens (Q) and kings (K)
- c.red cards, black cards and face cards
- d.From the tables, find the probability that one card drawn from the pack is:
- i.a spade
- ii.an ace
- iii.a red card
- iv.a black king
- v.a jack or a queen
- vi.not a king
Answer
19.2 Probability scale
No event can have fewer favorable outcomes than none, or more than all of S: 0 ≤ n(E) ≤ n(S). Dividing by n(S),
A probability of 0 means the event is impossible; a probability of 1 means it is certain, as P(S) = 1 always is. Every other event lies in between. The line from 0 to 1 on which probabilities are marked is the probability scale.
Which of these cannot be a probability?
Pick an answer to see why.
Exercise 19.2
Question 1
A coin is tossed once. Show the probabilities of its events on a probability scale (0 to 1).
Answer
Question 2
A bag has 2 blue, 3 black and 5 red marbles of the same size. One marble is drawn at random. Here n(S) = 2 + 3 + 5 = 10.
Find the probability of a black marble.
Answer
Find the probability of a marble that is not black.
Answer
Show the results of (a) and (b) on a probability scale.
Answer
Question 3
In a year of 365 days, 52 days are Sundays. One day of that year is picked at random. What is the probability that it is a Sunday? And that it is not a Sunday?
Answer
Question 4
A card is drawn from a well-shuffled pack of 52 cards.
What is the probability of a red card?
Answer
What is the probability of a red or a black card?
Answer
Show the two probabilities on a probability scale.
Answer
Question 5
The spinner is divided into four equal parts, yellow, red, blue and green. Find the probability that the pointer stops on each of the following, and show the results on a probability scale.
Four equal parts: n(S) = 4.
White.
Answer
Yellow.
Answer
Yellow or red.
Answer
Yellow, red or green.
Answer
Yellow, red, green or blue.
Answer
Show all the results above on a probability scale.
Answer
Question 6
A die with six faces is rolled. Show the probabilities on a probability scale.
Answer
Question 7
Cards numbered 2 to 25 are shuffled and one is drawn at random. There are 25 − 2 + 1 = 24 cards, so n(S) = 24.
What is the probability that its number is exactly divisible by 3?
Answer
What is the probability that its number is even?
Answer
19.3 Empirical probability
Counting says a coin gives a head with probability , so in 10 tosses we expect about heads, and in 20 tosses about . Try it, and you will often get 4 or 7 heads in 10. A real experiment rarely matches the count exactly.
A probability found by doing an experiment many times is an empirical probability (also called experimental probability):
This is the event’s relative frequency. The probability from counting, , is sometimes called the theoretical probability, to tell the two apart.
Over a few rolls the shares jump about. Over hundreds and thousands they settle near : the more trials, the closer the empirical probability usually comes to the theoretical one. That is why the empirical probability is the one we use where counting is impossible: no one can count the “equally likely outcomes” of a brick breaking, a seed sprouting or a baby being a boy, but records of many cases give the probability.
An empirical probability also predicts: in N more trials, the event is expected about N × P(E) times.
A coin is tossed 10 times and gives 7 heads. What is the empirical probability of a head?
Pick an answer to see why.
Back to Ludo
Ishwori asked whether a six is rarer than other faces.
No: on a fair die a six has probability , exactly the same as a three or any other face.
The widget shows it: after a few thousand rolls the six’s bar sits on the line with the others. Over many rolls a six comes about once in every six rolls. But that is an average. The same widget also keeps the longest wait for a six, and in a few hundred rolls it is nearly always longer than 8 rolls. Eight rolls without a six is unlucky, not strange: in Grade 10 you will work out that it happens nearly one time in four, . And the die is not keeping score: her next roll is a six with probability , however long she has waited.
How the exam asks it
Grade 9’s final exam is set to CDC’s specification grid for Compulsory Mathematics, Grades 9–10. There, Statistics and Probability is 11 marks in two questions. In the grid’s model paper, question 15 is on number cards:
| Part | Level | Marks | What it asks |
|---|---|---|---|
| a. | knowledge | 1 | the formula for P(E) |
| b. | understanding | 2 | the probability of an event |
| c. | application | 2 | the probability of an event not happening |
| d. | higher ability | 1 | when a probability is greatest, with a reason |
Here is one of our own in the same shape.
Exercise 19.3
Question 1
A class has 50 students, of whom 28 are girls. One student is picked at random for an essay competition. What is the probability that a girl is picked?
Answer
Question 2
Of the 35 students of Grade 9, 25 can speak and write English fluently. One student is picked at random for a quiz competition. What is the probability that the student picked can speak and write English fluently?
Answer
Question 3
Three coins are tossed together. Write the sample space, then answer.
What is the probability that all three show heads?
Answer
What is the probability of one head and two tails?
Answer
What is the probability of two heads and one tail?
Answer
What is the probability that all three show tails?
Answer
Question 4
A die is rolled. Write its sample space, S = {1, 2, 3, 4, 5, 6}, and find each probability.
A 5.
Answer
An even number.
Answer
An odd number.
Answer
Question 5
A die was rolled 60 times, with these results:
| Face | 1 | 2 | 3 | 4 | 5 | 6 |
|---|---|---|---|---|---|---|
| Frequency | 8 | 9 | 13 | 15 | 11 | 4 |
Find the empirical probability of each.
A 4.
Answer
More than 5.
Answer
Less than 3.
Answer
Question 6
Of 100 babies born in a hospital, 58 were girls. Find the empirical probability that a baby born there is a boy.
Answer
Mixed exercise
These questions cover Units 17, 18 and 19.
Question 1
Make a continuous series with classes of width 10 from these data:
50, 20, 65, 52, 41, 42, 70, 27, 59, 50, 39, 43, 33, 63, 60, 47, 44, 64, 32, 51, 57, 18, 55, 38, 54, 22, 31, 68, 26, 24, 37, 40, 66, 28, 35, 14, 43, 36, 34, 12
From the table:
- a.draw a histogram;
- b.draw a frequency polygon;
- c.draw the less-than and the more-than ogives on the same graph.
Answer
Question 2
Make a frequency table with classes of width 5 from these data:
45, 20, 23, 49, 47, 27, 29, 30, 32, 25, 34, 47, 45, 33, 33, 32, 37, 44, 42, 31, 42, 40, 35, 39, 26, 35, 27, 38, 34, 37
From the table:
- a.draw a histogram;
- b.draw a frequency polygon;
- c.draw the less-than and the more-than ogives on the same graph.
Answer
Question 3
Write any 5 values whose median is 15.
Answer
Write any 5 values whose mean and median are both 15.
Answer
Question 4
Find the arithmetic mean, median, mode, first quartile Q₁ and third quartile Q₃ of each.
| X | 35 | 40 | 45 | 50 | 55 | 60 | 65 |
|---|---|---|---|---|---|---|---|
| f | 2 | 9 | 10 | 9 | 6 | 3 | 1 |
Answer
| Age (years) | 5 | 15 | 25 | 35 | 45 | 55 |
|---|---|---|---|---|---|---|
| People | 8 | 10 | 12 | 18 | 12 | 4 |
Answer
| Cost (Rs) | 50 | 60 | 75 | 85 | 90 | 92 |
|---|---|---|---|---|---|---|
| Shops | 10 | 4 | 6 | 8 | 7 | 5 |
Answer
| Marks | 5 | 10 | 15 | 20 | 25 | 30 |
|---|---|---|---|---|---|---|
| Students | 7 | 6 | 8 | 4 | 5 | 10 |
Answer
Question 5
A fair six-faced die was rolled 56 times, with these results:
1, 6, 5, 6, 4, 3, 4, 4, 3, 5, 1, 1, 6, 6, 5, 4, 3, 2, 2, 2, 6, 5, 1, 4, 3, 1, 5, 4, 6, 4, 3, 2, 2, 3, 1, 1, 1, 1, 6, 6, 2, 1, 3, 6, 4, 1, 5, 6, 6, 1, 3, 5, 5, 4, 6, 3
Write the data as a discrete series (it is worked once here, in the answer to a), then:
Find the arithmetic mean.
Answer
Find the first, second and third quartiles.
Answer
Find the mode and the range.
Answer
Practice every question in the book, and keep track of the ones you miss →
Where these facts come from
- The unit follows CDC, Mathematics, Grade 9 (2022), Unit 19 and its Mixed Exercise, in English and Nepali. Its activities, examples and exercises are all here, worded our own way.
- The exam’s question: CDC, Specification Grid, Compulsory Mathematics, Grades 9–10: Statistics and Probability 11 marks in two questions, and its model question 15 on number cards 1 to 20 (1K, 2U, 2A, 1HA); our question is our own.
- Pascal, Fermat and the Chevalier de Méré (1654): Problem of points, Wikipedia.
- The IPCC’s likelihood words: IPCC, Climate Change 2021: The Physical Science Basis, Summary for Policymakers, footnote on its calibrated language (the same scale as its 2014 report).
- About 105 boys born per 100 girls, ranging from about 103 to 107: Our World in Data, Gender Ratio.
- The Ludo photo: Wikimedia Commons, credited under it.
- Every probability, frequency table, mean, median, mode and quartile in the unit: worked out from the data here, and checked by a script.
A companion to your textbook, not a replacement for it: study from the book your school uses, and where the two differ, follow your teacher. Found a mistake? Please tell us.