
Every three years a committee of the United Nations looks over its list of the world’s poorest countries, the ones it calls least developed, to see who is ready to leave. A country leaves by passing two of three tests at two reviews in a row. The first is income: in 2024 the line was $1,306 a person a year, averaged over three years. The second is a score for people’s food, health and schooling. The third measures how easily a country is knocked over by shocks, a flood, a failed harvest, a sudden fall in what it earns.
In the review of 2024 Nepal’s income came out at $1,300. It missed the line by six dollars a person. The other two tests it passed, as it had in every review since 2015, so it was due to leave the list on 24 November 2026. Then the government asked for more time, and on 29 October 2026 the UN’s General Assembly gave it three more years, with no country against. As of November 2026, Nepal is due to leave the list on 24 November 2029.
Six dollars short on one test, through on the other two. So is Nepal poor or not? It depends on what you count, and deciding what to count turns out to be most of the problem. Before the counting, though, comes the thing being counted: what people do all day, and where they do it.
Three kinds of work
Almost every job falls into one of three kinds. Some people take things straight from the land and the water: they farm, fish, cut timber or dig out rock and ore. Some make things out of what the first group brings in: a mill turns paddy into rice, a factory turns cotton into cloth and iron into nails. And a great many make nothing you can hold. They sell, carry, teach, heal, cook, mend, keep accounts and drive the bus. Economists in the first half of the twentieth century called these the primary, secondary and tertiary sectors of work, and noticed a pattern that has held ever since. As a country gets richer, its workers move out of the first kind, and in the end most of them are in the third.
The whole world has been making that move. In 1991 about 43 of every 100 workers on Earth farmed, fished or worked in forests. By 2025 it was about 26. In the world’s high-income countries it is now under 3 in 100; in the United States, 1.5. In the low-income countries it is still close to 60.
Nepal has made the move too, though not quite in the order the economists drew. In 1965 farming produced about two-thirds of the value of everything made and done in Nepal in a year; by 2025 it was about a fifth. But the factories never took up the slack. Manufacturing is still only about 5% of what Nepal produces. What grew instead was the third kind of work, which now makes up more than half: shops, buses and trucks, hotels, banks, schools, phone companies. Nepal went from the field to the counter and mostly skipped the factory floor. The economists’ order is a pattern, not a law.
Near the market, or near the mine
Each kind of work has its own pull on the map, and the first to work out how was a farmer. Johann Heinrich von Thünen owned an estate in Mecklenburg, in northern Germany, and in 1826 he published a book called The Isolated State. He imagined a single city in the middle of a flat plain, with the same soil everywhere, no rivers, no roads, and farmers carting everything to market themselves. What would they grow, and where?
Closest to the city, he reasoned, would be whatever spoils fast: milk, vegetables, fruit, which have to reach the market while they’re fresh. The next ring is forest. In his day wood was the fuel for every kitchen and the stuff of every building, and it’s so heavy that carting it far cost more than it was worth. Then come fields of grain, which keeps for months and is light for its value. Farthest out are cattle, which can walk to market on their own legs. Beyond that, nothing pays the cost of the journey, and the land is left wild.
No real country is a flat plain without roads, and von Thünen knew it. But his rings showed something true about all farming. A crop isn’t grown where the soil is best for it, exactly. It’s grown where the soil is good enough and the trip to the buyer is cheap enough, and the cost of the trip sorts the crops into rings around the market.
Factories are sorted by the same sum. In 1909 the German economist Alfred Weber asked where a factory should stand to keep its carrying costs lowest, and the answer depends on whether its goods lose weight or gain it as they’re made. Copper is the classic case of losing. The ore dug in this century holds, on average, well under 1% copper, so a tonne of rock gives up only a few kilograms of metal. Nobody hauls a mountain of waste across the world to throw it away at the other end, so the ore is concentrated near the mine.
Bottled drinks are the opposite. They’re mostly water, and water is found almost everywhere. Coca-Cola makes the concentrates and syrups for its drinks itself, then hands them to more than 200 bottling companies that mix, bottle and sell them, in more than 950 plants around the world. The flavor travels; the water is added close to the people who will drink it.
Why crowds pay
Distance explains why work spreads out. It can’t explain the opposite, which is the bigger story: work crowds together. Half of everything the world produces is made on 1.5% of its land. In the late 2000s Greater Tokyo held about 35 million people, a quarter of Japan, on less than 4% of its land, so packed that railway staff were employed to push passengers into the trains. Millions put up with it every morning, because that’s where the work and the wages are, and the only way to get a share of them is to live close by.
Why would firms choose to sit so tightly together, paying high rents beside their own competitors? The English economist Alfred Marshall gave the answer still quoted most. Where many people follow the same trade, he wrote, “The mysteries of the trade become no mysteries; but are as it were in the air, and children learn many of them unconsciously.” A good piece of work is noticed. A new idea is picked up by a neighbor, improved, and passed on. Shops spring up to sell the trade its tools and materials. Workers with the right skills come, because that’s where the jobs are, and firms come because that’s where the workers are.
Often a cluster starts from a small accident of place. Marshall’s own example was Sheffield, whose knife trade he put down chiefly to the excellent grit for its grindstones. Once a cluster has started, it can keep itself going long after the first reason has stopped mattering.
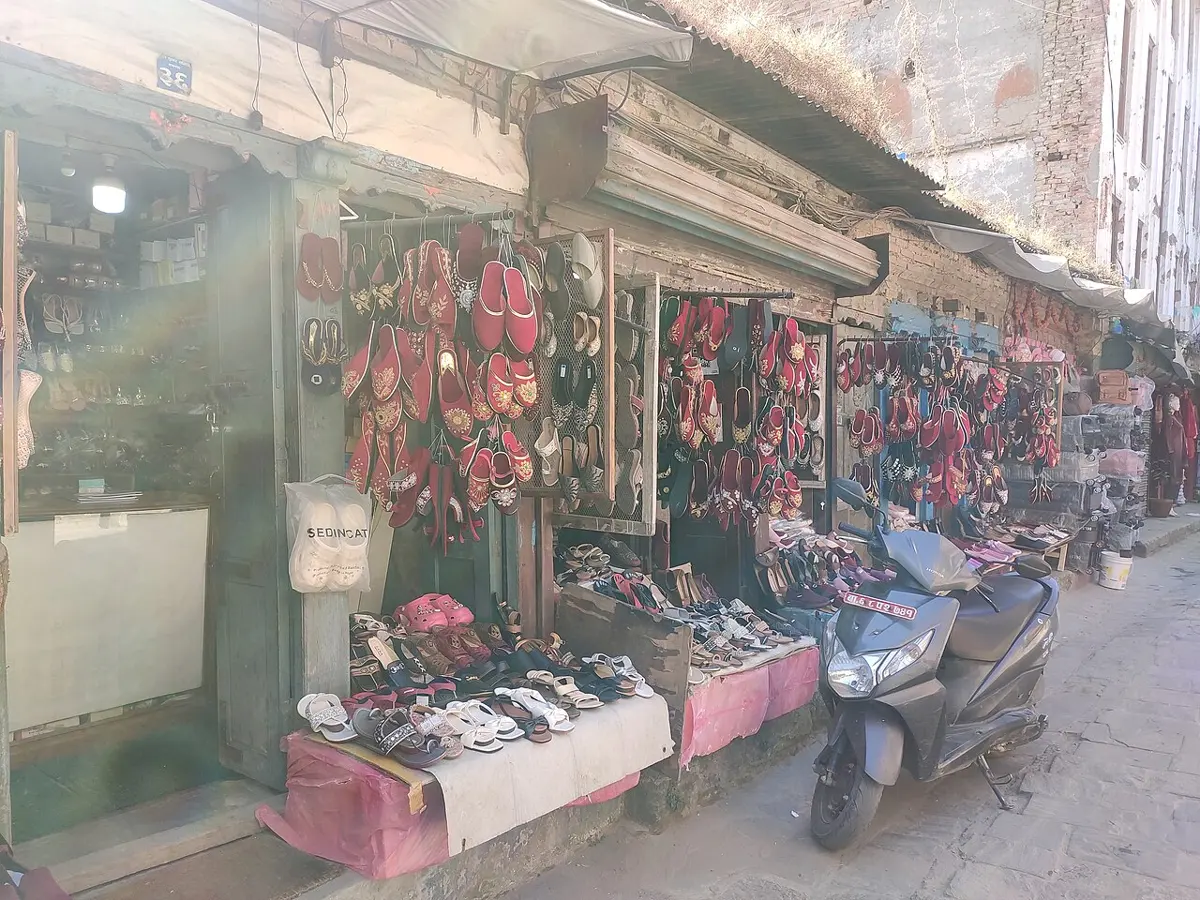
Shops do it on a small scale, every day. A street known for shoes is where people go to buy shoes, because they can compare many pairs in one walk, and so it’s where a new shoe shop wants to be, next door to its rivals. Services crowd hardest of all, since so many of them are people meeting people: lawyers near the courts, banks near each other, colleges where the students are, and all of them in the biggest cities.
The crowding has a price, and the places left out of it pay it. In Brazil, China and India, the states that lag behind have poverty rates more than twice as high as the states that are racing ahead. A new road can pull a town into the crowd, or, as Bandipur’s traders found when the highway went along the valley floor, leave it behind.
Counting rich and poor
So how do you tell a rich place from a poor one? The usual answer is to add up what all a country’s people earn in a year and divide by the number of people. That gives its income per person. Nepal’s was $1,570 in 2025.
That figure, though, turns rupees into dollars at the bank’s exchange rate, and much of what people buy in Nepal costs far less than it would in the United States. So economists also convert at what money really buys, which they call purchasing power. Measured that way, Nepal’s income per person in 2025 was about four times as much. For the United States the two numbers are nearly the same, $88,810 and $89,490, because the yardstick is its own dollar. The World Bank sorts countries into four groups by the first number: low, lower-middle, upper-middle and high income. Nepal is lower-middle, the band from $1,176 to $4,635.
The people who made such counts knew their limits. In 1932, in the depths of the Great Depression, the United States Senate asked for an estimate of the nation’s income. The work was put in the hands of an economist named Simon Kuznets, and his report, printed in 1934 and sold for 20 cents, said plainly what it left out. It counted only work whose results “appear on the market place”. The work done at home by housewives and other members of the family, he wrote, must be “imposing indeed” when added up across the country, and none of it was in. His conclusion: “The welfare of a nation can, therefore, scarcely be inferred from a measurement of national income”.
Nepal shows how much that leaves out. A generation ago, in Nepal’s villages, women brought in about 22% of their households’ money. Count the food they grew and the things they made for the family, which no one sold, and their share rose to 53%. Today’s labor statistics still have the same blind spot: by the international rule, someone who works for pay or profit is employed, and a family growing rice only for its own kitchen isn’t counted as employed in farming at all.
In 1989 the Pakistani economist Mahbub ul Haq was asked by the United Nations Development Programme to make something better. His first Human Development Report, in 1990, written with a team that included his old friend from Cambridge, the Indian economist Amartya Sen, opened its first chapter with a sentence that sums up the idea: “People are the real wealth of a nation.” It set out a new measure, the Human Development Index, built from three things: how long people live, how much schooling they get, and their income. It is a rough measure, and Haq’s team knew it. But it changed the map.
The report’s own example was Sri Lanka. With an income of $400 a person, Sri Lankans could expect to live 71 years, and 87 in 100 adults could read. In Brazil, with five times the income, people lived 65 years. In Saudi Arabia, with fifteen times, 64.
The same picture holds today. Richer countries mostly live longer, but the cloud is wide. Nepal, at about $4,700 a person (in the dollars of 2021, for 2023), lives a little over 70 years. Nigeria, a little richer at about $5,600, lives about 54. Japan lives five years longer than the United States on two-thirds of the income. Sri Lanka is still well above its place by income, 22 places higher on the index than it ranks by income alone, and Nepal is 10 places higher. Nepal’s index has risen from 0.404 in 1990 to 0.622 in 2023, 145th of 193 countries.
The index has its own blind spots, though, and the main one is that it’s an average. In 2023 Nepal’s adults had been to school for four and a half years on average, while a child starting school could expect almost fourteen. Both numbers go into the index, and neither describes the other. When the UN adjusts the index for how unequally health, schooling and income are shared out within each country, Nepal’s falls from 0.622 to 0.437, nearly a third lower.
The index also ignores what a country’s way of life does to the planet. Adjust it for the carbon dioxide each country puts into the air and the materials it uses up, and Norway, near the top of the list, falls from 0.970 to 0.723. Nepal falls only from 0.622 to 0.592. The average American is responsible for about 14 tonnes of carbon dioxide a year; the average Nepali, about half a tonne.
Where the official numbers can’t be trusted at all, economists have even measured incomes from space. A country’s lights at night, photographed by satellites, grow brighter as it gets richer, and in 2009 three economists showed that for the countries with the weakest statistics, the best estimate of how fast incomes are growing gives the lights about as much weight as the official figures.
Clumsy words
All of this is why the old words fit so badly. “Developed” sounds finished, as if there were one road with the rich countries at its end and everyone else somewhere along it. And “developing” puts a country where people live 70 years on $4,700 and one where they live 54 years on $5,600 in the same group, and it says nothing about who among a country’s people does well.
The organizations that count the world have been dropping the words. In 2016 the World Bank stopped grouping countries as “developing” in its data, pointing out that the group put Malawi, with an income of $250 a person, beside Mexico, with $9,860. It now uses only the four income groups, which make no promise to measure anything but income. The UN’s statistics office says simply: “There is no definition of developing and developed countries (or areas) within the UN system.” It had added the two groups to its list of countries in 1996, for convenience, and took them off in December 2021. When some users still wanted them, it made a separate list, on the understanding that which group a country is in is the country’s own decision, and South Korea has since chosen to be counted as developed.
The least developed list is different, because its tests are written down: three of them, with lines a country is either above or below. That’s how Nepal can be six dollars short on one and over the line on the others. Its people live longer and have more schooling than its income alone would suggest, and it earns less than its people’s health and schooling would suggest. No single word holds both of those, which is a good reason to look at the numbers and not the label.
Grade 10’s सामाजिक book works out the Human Development Index and compares it across South Asia, in Nepali, in मानव विकास सूचकाङ्क.
Found a mistake? Please tell us.