
In March 1865 a man from Kumaon named Nain Singh walked into Kathmandu carrying a string of prayer beads with something wrong with it. A Buddhist rosary has 108 beads. His had 100. Every tenth bead was bigger than the rest: the small ones were red, made to look like coral, and the big ones were dark, wrinkled seeds. He kept the string in his left sleeve, and every hundred steps he slipped one bead through his fingers. A big bead meant a thousand paces.
He was a surveyor for the British in India, and he was going where they couldn’t, to Lhasa. Tibet was closed to them, so he traveled dressed as a man from Ladakh, with a pigtail added to finish the disguise. He also carried a prayer wheel, the little drum on a handle that Buddhists spin as they walk, each turn a prayer. Inside his, where the printed prayer Om mani padme hum should have been, was a roll of blank paper, and the top was loose so that it could come off. On that paper he wrote down, in secret, which way the road ran and how many paces he had walked. Whenever anyone came up to talk, he set the wheel spinning. Someone turning a prayer wheel is taken to be lost in prayer, so he was hardly ever interrupted.
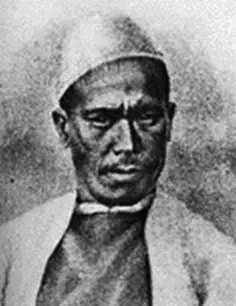
From Kathmandu he went north into Tibet, and on 10 January 1866 he reached Lhasa. Along the way he worked out heights by boiling water, which has its own story in the chapter on air, and at thirty-one places he measured his latitude from the stars, with a sextant he had to use where nobody could see him.
Look at what he was carrying and you have nearly everything a map needs. The beads said how far. The compass said which way. The stars said where on the Earth’s grid. The boiling water said how high. Put those together, leg after leg, and a road no survey had ever drawn becomes a line on paper that anyone can follow.
That is what a map is: a picture of the ground as seen from above, shrunk by a known amount, with north marked, and with signs that stand for what is there. Everything else in this chapter is detail on those few ideas, and a warning about the one thing no map can do.
What every map has
A globe is the honest kind of map, because the Earth is round and so is a globe. The oldest that still exists was made by Martin Behaim between 1490 and 1492 and stood in the town hall of Nuremberg, in Germany: a ball half a meter across, built of linen and painted by hand. It has no Americas. Columbus didn’t get back to Spain until March 1493.
A globe’s trouble is that you can’t fold it into a pocket, and you can’t see the whole world on it at once. So most maps are flat, on paper or a screen, and a book of flat maps is an atlas. The word comes from Gerardus Mercator, the Flemish mapmaker, who chose it for his collection of maps, published in 1595, a few months after his death. He wasn’t thinking of the giant in the Greek story who holds up the sky. He meant a King Atlas of Mauretania, in North Africa, who he believed had been the first great geographer.
Every map, flat or round, paper or digital, is built from the same few parts.
The first is scale: how much the ground has been shrunk. A map can say it three ways. It can give a ratio, 1:50,000, which means one centimeter on the map is 50,000 centimeters, half a kilometer, on the ground. It can say it in words, “1 cm to 500 m”. Or it can draw a bar marked in kilometers, which has the advantage of still being right after someone enlarges the map on a photocopier. The words are a little confusing. A large-scale map, 1:5,000 say, shows a small area in large detail, every house and lane. A small-scale map, 1:5,000,000, shows a large area with hardly any detail at all. Nain Singh’s beads were a scale of their own: a count of paces, turned into miles once he knew how long his pace was.
The second is direction. Most maps put north at the top, but that is only a habit. Many maps of medieval Europe put east at the top, with Jerusalem in the middle. A map usually says where north is with an arrow, and on a map with a grid of latitude and longitude, the grid says it too. The grid is the same one that sets Nepal’s clocks, and it gives every place on a map its own two numbers.
The third is a set of symbols. Nobody can draw every tree, so a map uses a little tree sign for a forest, a blue line for a river, a cross or a flag for a place of worship, and a key, or legend, to say what each sign means. There is nothing natural about them. They are agreements, and a map from another country may use different ones, which is why the key matters.
Then there is the compass, which Nain Singh needed every time the road turned. A compass needle doesn’t point at the North Pole. It lines up with the Earth’s magnetic field, which doesn’t quite line up with the Earth’s axis, and which drifts. The point where the field points straight down, the north magnetic pole, has been moving from Canada toward Siberia, in 2019 at about 55 km a year. So a compass is off from true north by an amount that depends on where you are and when. Nepal happens to be lucky. By the world’s standard model of the field, a compass in Kathmandu in 2026 points about half a degree east of true north, close enough not to matter on a walk. In New York it points about 13 degrees west of north, and a walker who ignored that would drift off course by more than 200 meters in every kilometer. Earth’s Magnetic Field on Our World shows the difference everywhere on Earth, and how it has changed since 1900.
Today most people find their way with GPS, which does with clocks what Nain Singh did with beads. At least 24 American satellites circle the Earth, each sending out its exact time and position, over and over. A receiver, the chip in a phone, notes when each signal arrives. Radio travels at the speed of light, so the delay says how far away each satellite is. With four satellites in view, it can work out where it is and also correct its own clock, which is far less precise than theirs. With help from nearby Wi-Fi signals, a phone can be right to about 5 meters. Russia, Europe, China and India run systems of their own, and many phones listen to several at once.
The maps on a phone add one more thing paper can’t: layers. Roads, rivers, buildings and shops are kept as separate sets of information and laid on top of each other, so the map can show only what you ask for. Some of those maps are made by volunteers. When the earthquake struck Nepal on 25 April 2015, more than 7,500 people around the world spent the next six weeks tracing roads and buildings from satellite pictures into OpenStreetMap, a free map anyone can edit, while Kathmandu Living Labs, in Kathmandu, worked between the mappers, the government and the aid groups arriving to help.
Lines of equal height
A flat map has no up and down, and Nepal is mostly up and down. Mapmakers solved this with one of their cleverest ideas, the contour line.
A contour line joins places that are at the same height above the sea. Imagine a hill that is sliced, like a loaf, by flat cuts 10 meters apart. Each cut leaves an outline where it passes through the hill. Draw all those outlines on one sheet, seen from above, and you have a contour map. Every line is labeled with its height, and you can read the hill without seeing it. Where the lines crowd close together, the ground climbs a long way in a short distance: it is steep. Where they spread far apart, it is gentle. Where they make small closed rings, one inside another, there is a hilltop.
Swayambhu’s hill is a good one to try it on, because it stands by itself on the flat floor of the valley, about a hundred meters high. On its north, east and south sides the lines are crowded: going 300 meters out from the top toward the east, the ground falls about 90 meters. To the west a long spur runs out, the lines spread apart, and over the same 300 meters the ground falls only about 45. A walker would feel that without being told. A map reader can see it before setting off.
Other shapes have their own patterns. A valley with a stream in it shows as lines bent into a V, and the V points upstream, which is uphill along the stream: each line has to run up the valley until it reaches the stream at its own height, then come back down the other side. A cliff is lines nearly on top of one another. A flat-topped hill is lines bunched at the edges with a wide empty middle.
The idea is older than it looks. Domenico Vandelli drew lines of equal height on a map of the Duchy of Modena, in Italy, in 1746. A few decades later Charles Hutton used them for a stranger purpose. In 1774 the Astronomer Royal, Nevil Maskelyne, measured how far the Scottish mountain Schiehallion pulled a plumb line sideways, as a way to weigh the whole Earth, and Hutton had to work out how much rock was in the mountain. He split the mountain into upright columns, and lines of equal height, drawn between the points his surveyors had measured, gave him each column’s height and showed the mountain’s shape at a glance.
Why every flat map lies
Try to flatten the peel of an orange and it tears. Something about a curved surface refuses to lie flat, and in 1827 the German mathematician Carl Friedrich Gauss proved that this isn’t a problem of skill. No flat map of a ball, or of any part of one, can keep every distance right. Something must be stretched or squeezed.
So every world map chooses what to get wrong. The most famous choice is Mercator’s. In 1569 he published a world map in eighteen sheets, about two meters wide, made for sailors. On it, a line of constant compass direction is a straight line, so a navigator could lay a ruler from port to port, read off the angle, and steer by it. To do that, Mercator had to stretch the map more and more toward the poles, north and south alike, until the poles themselves couldn’t be shown at all.
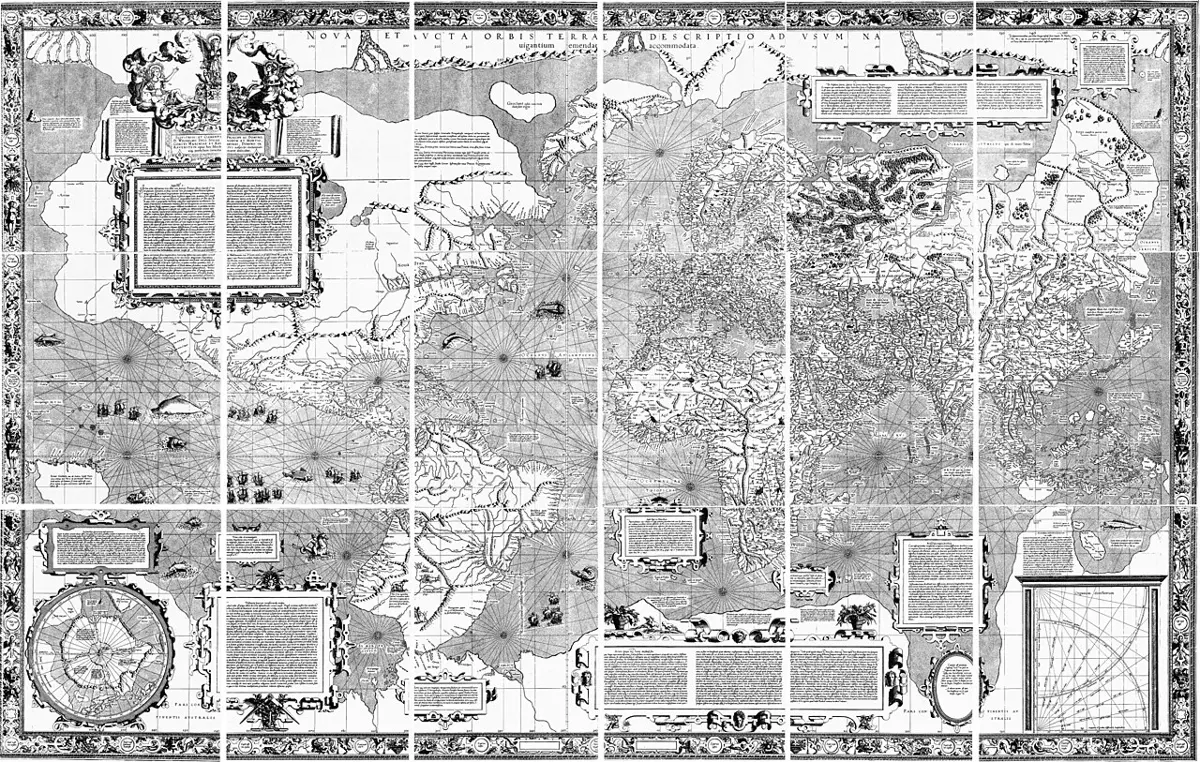
It worked for sailors. It has misled everyone else for four hundred years. On a Mercator map Greenland looks about as big as Africa. Africa is fourteen times bigger. Countries near the equator, much of Africa, India, Indonesia, Brazil, look small beside Europe, Russia and Canada. A version of Mercator’s map underlies the street maps of Google, OpenStreetMap and most other maps on the web, so the world many people carry in their heads is the stretched one.
Other maps keep areas right and pay for it by bending shapes, so that Africa looks long and thin or the edges of the map look squashed. Some keep distances right from one point only. None is the true one; each gives up something to keep something else. Flat Maps on Our World turns one projection into another in front of you, with circles of the same size that grow and shrink as they move, and True Size lets you drag a country to another latitude and watch its real size appear.
Maps that argue
There is a quieter way for a map to mislead, and it has nothing to do with projections. A map shows what its maker counted, and only that.
This website has a map of the world’s science centers and science museums, Science Centers of the World, with about 4,200 places on a spinning globe. It is useful for finding one. But count the dots. In the map’s list as it stood in October 2026, the United States had 914, Italy 456, India 75, and Nepal 5. Italy, with a small fraction of India’s people, has six times as many science museums on the map.
Some of that is real. Rich countries do have more museums. But some of it is the counting. The list was gathered from Wikipedia, its sister database Wikidata, and OpenStreetMap, and a place was kept only if it had a website or a Wikipedia article. Those are written by volunteers, and volunteers write most about the places they know. Of Nepal’s five, three are on the map only because we added them by hand. A museum in a town where nobody has written it up simply isn’t there. The map is partly a map of science museums and partly a map of who writes about them.
Every thematic map carries a choice like that. A map of disease shows the cases that were reported, which is not the same as the cases that happened. A map of a country’s borders shows the borders its government claims, which is why Nepal’s official map since 2020 includes Kalapani, Lipulekh and Limpiyadhura and India’s doesn’t, as the chapter on Nepal’s place explains. None of this makes maps useless. It makes them worth reading the way you would read anything else: asking who made it, what they counted, and what they left out.
In Nepali, the सामाजिक books work through maps grade by grade: scale and signs in Grade 6, reading maps in Grade 7, the signs and drawing Nepal in Grade 8, the kinds of map and scale in Grade 9, and GIS and GPS in Grade 10.
Nain Singh went on surveying for another ten years. On his last great journey, in 1874 and 1875, from Ladakh across Tibet to Lhasa and down into Assam, he paced and took bearings along 1,319 miles, about 2,100 km, about 1,200 of those miles through country no surveyor had explored before. He measured his latitude from the sun and stars 276 times and boiled his thermometer 497 times. By the end his eyesight was badly damaged. In 1877 the Royal Geographical Society in London gave him one of its two gold medals, the Patron’s Medal, for having “determined the position of Lhasa and added largely to our knowledge of the map of Asia”. In 2004 India put his face on a postage stamp.
Every map on a phone is a descendant of that rosary. The beads have become satellites and the prayer wheel a chip, but the questions are the same ones he answered on foot: how far, which way, how high, and where.
Found a mistake? Please tell us.