
How many tigers live in Nepal? You can’t line them up. They live alone, in tall grass and thick sal forest, they walk mostly at night, and a tiger hears you long before you see it. Even the people who study them may go years without seeing some of them.
Yet in July 2026 the government gave a number: 429 wild tigers, from its fifth national tiger survey. Nobody saw 429 tigers. So how can anyone know?
The trick works on anything you can’t count one by one: tigers in a forest, fish in a pond, ants in a nest. Try it on fish first. Somewhere in this pond are fish you can’t count. Catch some, tag them, let them go. Then catch again.
You tagged 20 fish and let them go. A day later you catch 20 fish, and 4 of them have tags. About how many fish are in the pond?
Pick an answer to see why.
You need: the blocks from Grade 7 (Variables and Choices); the Python parts from Grade 8 (loops, lists and functions).
Try it
Play with the pond above.
- a.Catch again five or six times without starting a new pond. Do the estimates agree? Look at the dots: are they close together, or spread out?
- b.Press New pond, and change the net to 10 fish. Catch and mark, then catch again several times. What happens to the dots? What happens when no tagged fish comes up in the net?
- c.Now try a net of 40 fish in a new pond.
How it works
Suppose 1 in 5 of the fish in your second net has a tag. If the tagged fish have swum off and mixed with the others, your net is like a spoonful of dal from a well-stirred pot: what is in the spoon is what is in the pot. So about 1 in 5 of all the fish have tags.
You know how many fish have tags, because you tagged them. So:
- tagged fish ÷ all fish ≈ tagged in the net ÷ fish in the net
- all fish ≈ tagged × fish in the net ÷ tagged in the net
This way of counting is called capture–recapture (or mark–recapture): capture some, mark them, let them go, and recapture later. The number it gives is an estimate: a careful guess worked out from a sample, not a count.
When it goes wrong
The rule works only if the second catch is a fair sample: every fish, tagged or not, must have the same chance of being in it. Things that spoil that:
- The tagged fish don’t mix: they stay where you caught them.
- Some fish live where no net ever goes.
- A tagged fish learns to keep away from nets.
- Fish are born, die or swim away between the two catches.
Program it
With blocks
Here is the second catch as a block program. The pond has 150 fish, and 30 have tags. Each fish in the net of 40 is looked at and put straight back, and a random number from 1 to 150 says whether it has a tag: 1 to 30 means yes, 31 to 150 means no, so a tag comes up 30 times in 150, just as in the pond.
In Python (from Grade 8)
Now the same in Python, with one change: a caught fish stays in the net, as in a real one, so the program counts the fish left (left) and the tagged fish left (marked_left). random.randint(1, left) picks a whole number from 1 to left; random.seed(1) makes the luck come out the same every time, so your output matches the page’s (change the 1 to see another pond’s luck).
import randomrandom.seed(1) fish = 150 # the real number: the program knows it, the scientist doesn'tmarked = 30 # caught, tagged and let gocaught = 40 # the second net left = fishmarked_left = markedrecaught = 0for i in range(caught): if random.randint(1, left) <= marked_left: # this fish has a tag recaught = recaught + 1 marked_left = marked_left - 1 left = left - 1 print('Tagged fish in the second net:', recaught)print('Estimate:', round(marked * caught / recaught))Output
Tagged fish in the second net: 9Estimate: 133The program knows there are 150 fish. The rule, which doesn’t, says 133. Close, but not right. Was that bad luck?
Many surveys
To find out, put the second net in a function, survey, and run it again and again.
import randomrandom.seed(2) def survey(fish, marked, caught): left = fish marked_left = marked recaught = 0 for i in range(caught): if random.randint(1, left) <= marked_left: recaught = recaught + 1 marked_left = marked_left - 1 left = left - 1 return recaught for i in range(5): found = survey(150, 30, 40) print(found, 'tagged in the net, so about', round(30 * 40 / found), 'fish')Output
10 tagged in the net, so about 120 fish2 tagged in the net, so about 600 fish9 tagged in the net, so about 133 fish12 tagged in the net, so about 100 fish11 tagged in the net, so about 109 fishFive surveys of the same pond, and the answers run from 100 to 600. One unlucky net with only 2 tags made the estimate four times too big.
So how big must the nets be? Let a program run a thousand surveys for each size of net and count how many estimates land close, within a tenth of the real 150 (from 135 to 165), and how many nets bring up no tags at all: the nets that would crash the program, as the blocks did.
import randomrandom.seed(1) def survey(fish, marked, caught): left = fish marked_left = marked recaught = 0 for i in range(caught): if random.randint(1, left) <= marked_left: recaught = recaught + 1 marked_left = marked_left - 1 left = left - 1 return recaught def try_nets(fish, marked, caught): close = 0 # estimates within a tenth of the real number nothing = 0 # nets with no tagged fish: no estimate at all for i in range(1000): found = survey(fish, marked, caught) if found == 0: nothing = nothing + 1 else: estimate = marked * caught / found if estimate >= fish * 0.9 and estimate <= fish * 1.1: close = close + 1 print('Tag', marked, 'and catch', caught, ':', close, 'close,', nothing, 'with no tags') try_nets(150, 10, 10)try_nets(150, 30, 40)try_nets(150, 60, 60)try_nets(150, 100, 100)Output
Tag 10 and catch 10 : 0 close, 494 with no tagsTag 30 and catch 40 : 167 close, 0 with no tagsTag 60 and catch 60 : 610 close, 0 with no tagsTag 100 and catch 100 : 989 close, 0 with no tagsWhen the sample isn’t fair
Your program can also try the things that go wrong. Here 50 of the 150 fish hide where no net goes, or the tagged fish learn to keep away from nets. To make a tagged fish less likely to be caught, the program works out the chance that the next fish is tagged and compares it with random.random(), a random number from 0 up to 1. Each line is the average of 1,000 surveys.
import randomrandom.seed(1) def survey(fish, hiding, marked, caught, shy): # hiding: fish that live where no net ever goes # shy: 1 if a tagged fish swims into a net as often as any other, # 0.5 if it has learned to keep away and does it half as often left = fish - hiding marked_left = marked recaught = 0 for i in range(caught): plain_left = left - marked_left chance = marked_left * shy / (marked_left * shy + plain_left) if random.random() < chance: recaught = recaught + 1 marked_left = marked_left - 1 left = left - 1 return recaught def average(fish, hiding, marked, caught, shy): total = 0 for i in range(1000): total = total + marked * caught / survey(fish, hiding, marked, caught, shy) return round(total / 1000) print('All 150 fish alike: ', average(150, 0, 60, 60, 1))print('50 hide where nets never go:', average(150, 50, 60, 60, 1))print('Tagged fish keep away: ', average(150, 0, 60, 60, 0.5))Output
All 150 fish alike: 15350 hide where nets never go: 100Tagged fish keep away: 222When the fish hide, the rule doesn’t know they exist: it finds only the 100 a net can reach. When tagged fish keep away, it finds far too many. No amount of arithmetic fixes a sample that isn’t fair; only a better way of sampling does. (Even when every fish is alike, the average, 153, is a little over 150: with small nets this rule tends to guess slightly high. Going further still, below, has a fix.)
Counting tigers
You can’t put a tag on a tiger. But a tiger carries its own: its stripes. No two tigers have the same pattern, and a tiger keeps its pattern all its life, so a photo of its side says which tiger it is, like a fingerprint. The two sides of one tiger have different patterns, so scientists put cameras in pairs, one on each side of a forest path, to photograph both sides at once.
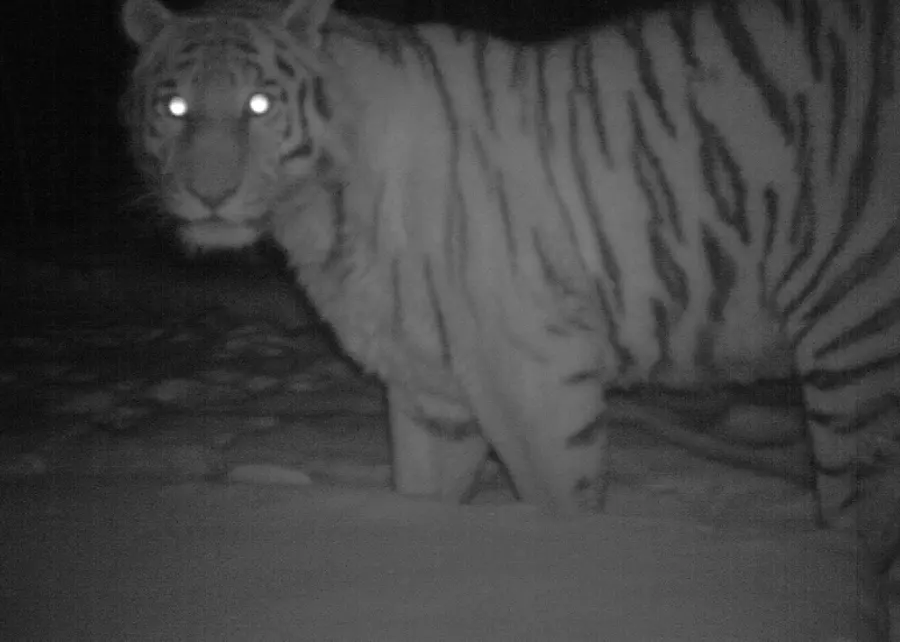
A camera trap is a small camera with a sensor that notices the heat and movement of an animal passing in front of it, and takes its picture, day or night. Nobody needs to be there. Each photo is stored with its date and time.
So the first time a camera photographs a tiger, the tiger is “captured” and its stripes are its tag. Every later photo of the same stripes is a “recapture”. Over many nights, the survey builds up, for each tiger, a list of when it was photographed: its capture history.
Program the cameras
This program makes up a forest with 20 tigers, a number the scientists don’t know. Cameras watch for 40 nights, and each night each tiger has a chance of 4 in 100 of passing one. The program draws each tiger’s capture history as a row, a black square for each night it was photographed, with show_grid from pixels, this page’s own module for small pictures. Then it splits the nights in two: the first 20 nights are the first “catch”, the last 20 the second.
import randomfrom pixels import show_gridrandom.seed(1) tigers = 20 # the real number, hidden from the scientistsnights = 40 # the cameras watch for 40 nightschance = 4 # in 100: the chance that a tiger passes a camera on one night rows = []seen = 0first = 0 # seen in the first 20 nightssecond = 0 # seen in the last 20 nightsboth = 0 # seen in both halvesfor t in range(tigers): row = '' if t % 2 == 0: blank = '.' else: blank = ',' # every second row is shaded gray in_first = False in_second = False for n in range(nights): if random.randint(1, 100) <= chance: row = row + '#' if n < nights // 2: in_first = True else: in_second = True else: row = row + blank rows.append(row) if in_first or in_second: seen = seen + 1 if in_first: first = first + 1 if in_second: second = second + 1 if in_first and in_second: both = both + 1 show_grid(rows, {'#': 'black', '.': 'white', ',': 'gainsboro'})print('Tigers photographed:', seen)print('Seen in the first half:', first)print('Seen in the second half:', second)print('Seen in both halves:', both)print('Estimate:', round(first * second / both))Output
Tigers photographed: 16Seen in the first half: 9Seen in the second half: 14Seen in both halves: 7Estimate: 18Picture

(rows.append(row) adds the row to the end of the list rows, which show_grid draws; a night with no photo is . or ,, white or gray, so the rows are easy to tell apart.)
Look at the picture. Four rows are empty: four tigers walked through this forest for 40 nights and never passed a camera. The survey photographed 16 tigers, but the estimate says about 18, and the real number is 20.
Why is the estimate bigger than the number of tigers photographed?
Pick an answer to see why.
What your program shows
One forest is one roll of the dice. Run the camera survey 500 times and compare, on average, the tigers photographed with the estimate. (A function can give back two values at once, return seen, estimate, and the caller takes them apart with seen, estimate = camera_survey(…).)
import randomrandom.seed(1) def camera_survey(tigers, nights, chance): seen = 0 first = 0 second = 0 both = 0 for t in range(tigers): in_first = False in_second = False for n in range(nights): if random.randint(1, 100) <= chance: if n < nights // 2: in_first = True else: in_second = True if in_first or in_second: seen = seen + 1 if in_first: first = first + 1 if in_second: second = second + 1 if in_first and in_second: both = both + 1 return seen, first * second / both total_seen = 0total_estimate = 0all_seen = 0for i in range(500): seen, estimate = camera_survey(20, 40, 4) total_seen = total_seen + seen total_estimate = total_estimate + estimate if seen == 20: all_seen = all_seen + 1 print('Real tigers: 20')print('Photographed, on average:', round(total_seen / 500, 1))print('Estimate, on average:', round(total_estimate / 500, 1))print('Surveys that photographed every tiger:', all_seen, 'of 500')Output
Real tigers: 20Photographed, on average: 16.2Estimate, on average: 20.9Surveys that photographed every tiger: 4 of 500(first * second / both divides by both. In about 1 survey in 3,000 no tiger is photographed in both halves, and Python would stop with ZeroDivisionError: such a survey can’t give an estimate, as with the fish. If you change the seed, the nights or the chance and see that error, that’s why.)
- Counting the tigers photographed is always too low: 16 of the 20 on average, and only 4 surveys in 500 photographed every tiger.
- The estimate is right on average: about 21 for 20 tigers (a little high, as with the fish). No single survey is right to the last tiger, but the method doesn’t lean towards too few.
- The aha: you don’t need to see every tiger to know how many there are. How often you see the same ones again tells you how many you have missed.
That is why a tiger survey reports more tigers than its cameras photographed. In 2018, cameras in Parsa National Park and the forests around it took 294 photos of tigers. From their stripes, scientists told apart 15 adult tigers, and estimated that 18 lived there (from 16 to 24, they said, given the luck of the cameras). Real surveys use cleverer arithmetic than our two halves (they also use where each camera was), but the idea underneath is the one your program used.

Going further still
Use every night, not just two halves. Splitting 40 nights into two catches throws information away. On each night, count the tigers photographed and how many of them had been seen before; add up across the nights. The ★★★ challenge does it, and makes better estimates from the same photos. (It is called the Schnabel estimate.)
A fix for guessing high. Statisticians suggest a small change for small samples: (tagged + 1) × (net + 1) ÷ (tagged in the net + 1) − 1. Put it into the average program above. Is the average closer to 150? Does it still crash when no tags come back?
Challenges
★ Catch more (blocks)
Finish the program so that it says the estimate, tagged × net ÷ tagged in the net, but says Catch more when no tagged fish came up in the net. Then press Test.
★★ Two halves of photos (Python, from Grade 8)
A survey gives you two lists of the names of tigers photographed, first (the first half of the nights) and second (the second half). A tiger photographed three times appears three times. Write tiger_estimate(first, second) that gives back the estimate, rounded to a whole number, or None if no tiger is in both lists.
def tiger_estimate(first, second): # first, second: lists of tiger names, with repeats return 0 print(tiger_estimate(['Kanchi', 'Raja', 'Bhim', 'Laxmi'], ['Raja', 'Laxmi', 'Kale']))★★★ Every night counts (Python, from Grade 8)
Now use every night. nights is a list with one list a night, the names of the tigers photographed that night. Go through the nights in order. For each night, with seen before the number of different tigers photographed on earlier nights, tonight the number photographed tonight, and again how many of tonight’s had been seen before, add up tonight × seen before over all the nights, and add up again over all the nights. The estimate is the first total ÷ the second, rounded. Write every_night(nights), giving back None if the second total is 0.
def every_night(nights): # nights: a list of lists of tiger names, one list a night return 0 print(every_night([['Kanchi', 'Raja'], ['Raja', 'Bhim'], ['Kanchi', 'Bhim', 'Laxmi']]))Questions
In a survey of fish, 50 are tagged, and a second net of 60 holds 10 tagged fish. About how many fish are there?
Pick an answer to see why.
How do scientists “tag” a wild tiger in a camera-trap survey?
Pick an answer to see why.
A survey photographs 15 different tigers, but reports an estimate of 18. Explain why the estimate is bigger than the number photographed, and why that is not cheating.
Answer
Tagged fish learn to keep away from nets. Will the estimate be too big or too small? Why?
Answer
Where to go next
- Grade 6, Collecting data: asking questions and recording the answers.
- Grade 7, A class survey: a survey in a spreadsheet, and what its numbers can and can’t tell you.
- Grade 8, Counting and adding up: the counting loops this topic’s programs are built from.
- How can throwing rice find π? Another number found from random samples, and how slowly it gets better.
- Why are there so few tigers? The science of why a forest can feed only a few tigers.
Found a mistake? Please tell us.