
Write the digit ४ on a piece of paper. Now ask three friends to write one too. No two will look the same: one is round, one is pointed, one leans to the left, one has a long tail. Yet you read every one of them at once. Try to write down the rule you use, a rule a computer could follow, and you will find you can’t. Nobody can. There are too many ways to write ४.
So computers that read handwriting aren’t given rules. They are given thousands of examples, each with its right answer, and they learn. In Grade 9 you built a model that learns from examples, nearest neighbors, and in Grade 10 you saw that a chatbot is billions of numbers tuned by training. In this unit you open up the kind of model behind those chatbots and almost every other AI today: the neural network. You will build one neuron by hand, see why one is not enough, watch a network learn by taking small steps downhill, and then train a real network, on this page, to read handwritten digits, ०–९ as well as 0–9. Then comes the most important part: looking inside it to see what it really learned, and where it fails.
A neuron: a weighted vote
Every Saturday morning, the captain of a school cricket club in Bhaktapur decides whether the match goes ahead. Three things matter to her: are there enough players, is the ground dry, and are there exams on Monday? They don’t matter equally. Enough players matters most; exams on Monday count strongly against playing. In her head she gives each one a weight, adds them up, and decides.
Write that down as numbers. Each question is an input, 1 for yes and 0 for no. Each input has a weight: how much it counts, and which way. A positive weight votes for playing, a negative one against. And one number says how hard it is to say yes at all, whatever the inputs: the bias.
| Input | Weight |
|---|---|
| enough players? (1 or 0) | 3 |
| ground dry? (1 or 0) | 2 |
| exams on Monday? (1 or 0) | −4 |
| bias | −4 |
To decide, multiply each input by its weight, add them up, and add the bias. This total is the weighted sum. If it is above 0, the answer is 1, play; otherwise 0, don’t. Enough players and a dry ground, no exams: 3 + 2 + 0 − 4 = 1, above 0: play. Enough players but a wet ground: 3 + 0 + 0 − 4 = −1: don’t play.
That is an artificial neuron: inputs, a weight for each, a bias, the weighted sum, and a rule that turns the sum into the neuron’s output. The rule is called the activation function. The one here, 1 above 0 and 0 otherwise, is called a step, because its graph jumps up like a step.
A neuron is a weighted vote: each input votes, some votes count more than others, some vote against, and the bias sets how many votes it takes to win.
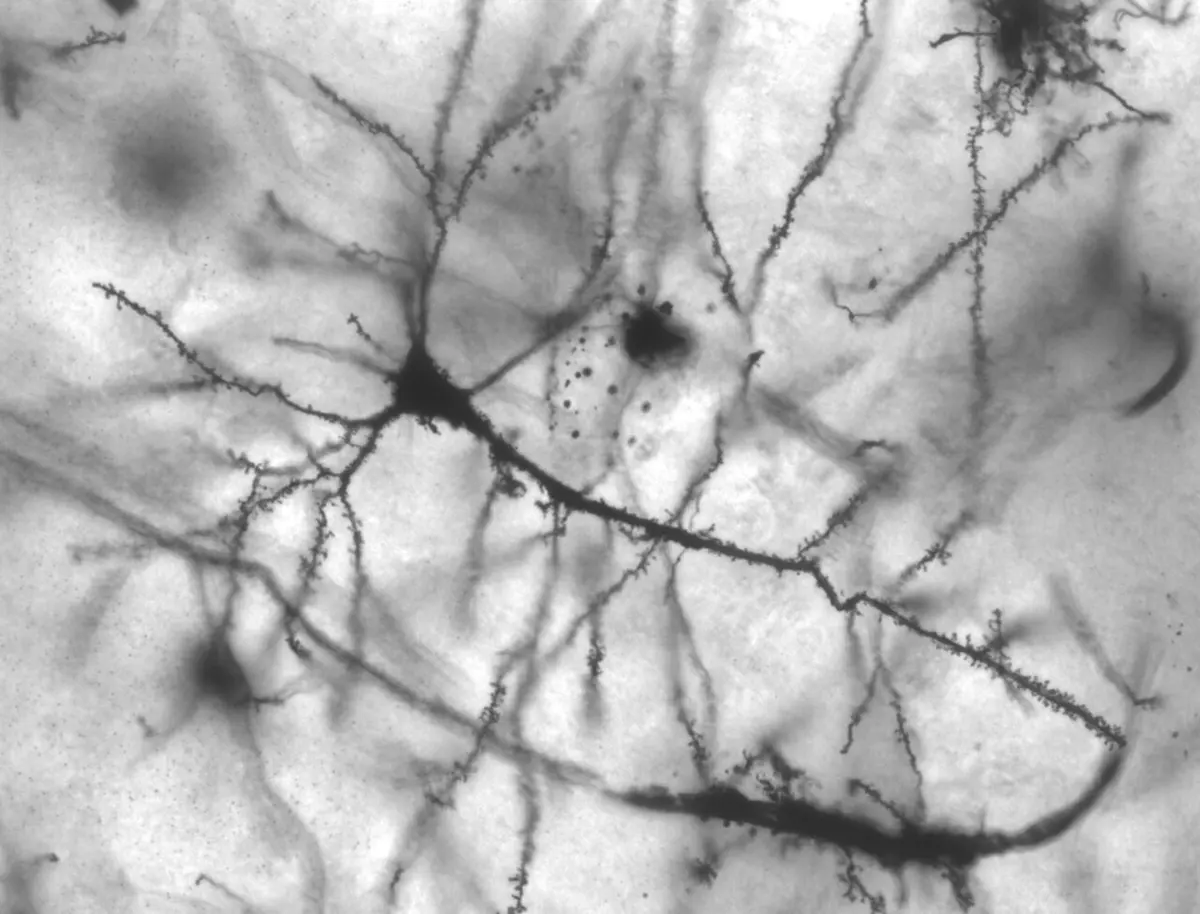
The name comes from the brain. A real neuron (a nerve cell) collects small signals from thousands of other neurons. Some make it more likely to fire, some less. When enough arrive together, it fires a signal of its own. The artificial neuron borrows that one idea, many weighted signals added up against a threshold, and leaves out almost everything else a living cell does.
In Python, a neuron is a short function. Here is the captain’s:
def neuron(inputs, weights, bias): """A neuron with a step: 1 if the weighted sum is above 0, else 0.""" total = bias for x, w in zip(inputs, weights): total = total + x * w return 1 if total > 0 else 0 # enough players, ground dry, exams on Monday (1 for yes, 0 for no)weights = [3, 2, -4]bias = -4print(neuron([1, 1, 0], weights, bias))print(neuron([1, 0, 0], weights, bias))print(neuron([1, 1, 1], weights, bias))print(neuron([0, 1, 0], weights, bias))Output
1000zip(inputs, weights) takes the inputs and the weights in pairs, the first with the first and so on, so the loop adds up input × weight for each pair. Only the first case, enough players and a dry ground with no exams, gets the match played.
A neuron has inputs 1 and 0, weights 2 and 5, and bias −1, with a step activation. What is its output?
Pick an answer to see why.
In the captain’s neuron, what does the weight −4 on “exams on Monday” mean?
Pick an answer to see why.
A neuron as a logic gate
In Grade 7 you met logic gates Grade 7: Logic gates: an AND gate gives 1 only when both inputs are 1, and an OR gate gives 1 when at least one is. A single neuron with two inputs can act as either one. You only have to find the right weights and bias.
Look at the square as you change the bias. The neuron’s rule, “say 1 where w₁ x₁ + w₂ x₂ + bias is above 0”, always cuts the square with one straight line. Changing the weights turns the line; changing the bias slides it. A neuron can only ever say 1 on one side of a line and 0 on the other.
What one neuron can’t do
Now try XOR in the widget, the “one or the other but not both” gate from Grade 7: 1 for (0, 1) and (1, 0), 0 for (0, 0) and (1, 1). However you move the sliders, at least one row stays wrong.
The square shows why. XOR’s filled points sit at two opposite corners, and its empty points at the other two. To give 1 for both filled points, the shaded side must hold both of them; but any straight line with the two filled corners on one side has at least one empty corner there too. No line can split them, so no single neuron can be an XOR gate, whatever its weights.
Why can no single neuron act as an XOR gate?
Pick an answer to see why.
Layers
If one neuron draws one line, two neurons can draw two lines. Put two neurons side by side, both looking at the same inputs, and then a third neuron that looks at their outputs. That is a small neural network, and it can do XOR.
The neurons are arranged in layers. The input layer is just the inputs, x₁ and x₂: no neurons, no weights. The output layer gives the network’s answer. Every layer between them is a hidden layer: its outputs aren’t the answer, and nobody tells it what they should be. Here the hidden layer has two neurons. Each layer takes the outputs of the layer before it as its inputs.
Working out a network’s answer means going layer by layer, from the inputs to the output. This is called the forward pass. For Figure 8.3:
| x₁ | x₂ | h₁ = step(x₁ + x₂ − 0.5) | h₂ = step(−x₁ − x₂ + 1.5) | output = step(h₁ + h₂ − 1.5) |
|---|---|---|---|---|
| 0 | 0 | step(−0.5) = 0 | step(1.5) = 1 | step(−0.5) = 0 |
| 0 | 1 | step(0.5) = 1 | step(0.5) = 1 | step(0.5) = 1 |
| 1 | 0 | step(0.5) = 1 | step(0.5) = 1 | step(0.5) = 1 |
| 1 | 1 | step(1.5) = 1 | step(−0.5) = 0 | step(−0.5) = 0 |
The output column is XOR. The same forward pass in Python, reusing the neuron function:
def neuron(inputs, weights, bias): total = bias for x, w in zip(inputs, weights): total = total + x * w return 1 if total > 0 else 0 def xor_network(x1, x2): h1 = neuron([x1, x2], [1, 1], -0.5) # the hidden layer: OR... h2 = neuron([x1, x2], [-1, -1], 1.5) # ...and NAND return neuron([h1, h2], [1, 1], -1.5) # the output layer: AND of the two for x1 in [0, 1]: for x2 in [0, 1]: print(x1, x2, "->", xor_network(x1, x2))Output
0 0 -> 00 1 -> 11 0 -> 11 1 -> 0A network with many hidden layers, one after another, is called a deep network, and training one is deep learning. More layers let a network build ideas on ideas: in a network that reads photos, the first layers find edges, later ones shapes made of edges, and later still whole objects made of shapes.
In a forward pass, what does a hidden layer take as its inputs?
Pick an answer to see why.
From a step to a smooth curve
The step has a problem, which you will meet properly in the next section. A tiny change to a weight usually changes nothing at all: the sum moves a little, stays on the same side of 0, and the output stays the same. Then the change jumps the sum across 0, and the output leaps from 0 to 1. To learn by small corrections, a network needs small changes in its weights to make small changes in its output.
So networks that learn use a smooth activation function instead. A common one is the sigmoid, an S-shaped curve:
where z is the weighted sum and e is the number 2.718… (Euler’s number, the same Euler as Unit 5’s method). You don’t need to work it out by hand; what matters is its shape:
| sum z | −4 | −2 | 0 | 2 | 4 |
|---|---|---|---|---|---|
| sigmoid σ(z) | 0.02 | 0.12 | 0.5 | 0.88 | 0.98 |
A big negative sum gives nearly 0, a big positive sum nearly 1, like the step; but in between the output changes smoothly. A sigmoid neuron’s output is a number between 0 and 1, which can be read as “how sure it is”. (Large networks today often use an even simpler activation called ReLU: the sum itself if it is above 0, else 0. The idea is the same: a simple rule applied to the weighted sum.)
A network that reads digits
A handwritten digit, for a computer, is a picture: a grid of pixels, each a number. In this unit the pictures are 14 × 14 = 196 pixels, each from 0 (paper) to 1 (ink). Those 196 numbers are the network’s inputs, one per pixel.
The 4: from MNIST, by Yann LeCun, Corinna Cortes and Christopher J. C. Burges (© Yann LeCun and Corinna Cortes), CC BY-SA 3.0; shrunk to 14 × 14 by Science Playground and shared under the same license
Each of the 32 hidden neurons has 196 weights, one for every pixel, and a bias: 196 × 32 = 6,272 weights and 32 biases. Each of the 10 output neurons has 32 weights, one for every hidden neuron, and a bias: 320 weights and 10 biases. In all, 6,634 numbers, the network’s parameters (Grade 10’s word). Training must find good values for all of them.
There is one output neuron for each digit, 0 to 9. A last step, called softmax, turns the ten outputs into chances that are all positive and add up to 100%. The network’s answer is the digit with the biggest chance. For the 4 in Figure 8.4, the output for 4 should be the largest. (Its error is measured by how small a chance it gave the right digit, rather than by squared misses as in the next section, but it is made smaller in exactly the same way.)
Compare this with Grade 10’s language models Grade 10: Training: from random numbers to a model: they are made of the same parts, neurons with weights in layers, but with billions of parameters instead of 6,634, and built to take in tokens instead of pixels.
A network has 100 inputs, one hidden layer of 20 neurons and 5 outputs. How many weights (not counting biases) does it have?
Pick an answer to see why.
Learning by small corrections
A network’s weights start as random numbers, so at first its answers are nonsense. Training changes the weights, a little at a time, until the answers are good. To see how, start with the smallest model there is: one weight.
One weight: the price of a plate of momos
A friend has four bills from a momo shop, but the menu is lost. How much is one plate? The bills don’t quite agree (maybe a tip was added, maybe the price changed):
| Plates | Bill (Rs) |
|---|---|
| 1 | 160 |
| 2 | 300 |
| 3 | 470 |
| 4 | 610 |
The model is: bill = w × plates, where w, the price of a plate, is its one weight. For any guess of w the model misses each bill by some amount. Square each miss (so misses above and below both count, and big misses count a lot), and take the average. That number is the model’s error (also called its loss): how wrong it is, in one number. Learning means making the error small.
Plot the error for every possible w and you get a bowl (the widget below draws it): a big error far below the best price, a big error far above it, and a lowest point at the best price in between. The model doesn’t know where the bottom is. It only knows where it is now, and it can feel the ground under its feet: the slope of the bowl at its current w, how fast the error changes as w grows.
- If the slope is negative, the error goes down as w goes up: make w bigger.
- If the slope is positive, make w smaller.
- The steeper the slope, the farther from the bottom, so the bigger the step can be.
All three fit into one rule, repeated:
The learning rate is a small number we choose: how big a step to take for each unit of slope. Each repeat is one small correction, downhill. This is gradient descent: “gradient” is another word for slope, and “descent” means going down.
How does the program know the slope? The simplest way needs no calculus: nudge w by a tiny amount and see how much the error changes. The change in error divided by the nudge is the slope. Here is the whole of gradient descent for one weight:
# The price of a plate of momos, learned from four billsbills = [(1, 160), (2, 300), (3, 470), (4, 610)] # (plates, total in rupees) def error(w): """The average of the squared misses, if a plate costs w rupees.""" total = 0 for plates, paid in bills: miss = w * plates - paid total = total + miss * miss return total / len(bills) def slope(w): """How fast the error changes as w grows: nudge w a tiny bit and see.""" tiny = 0.001 return (error(w + tiny) - error(w)) / tiny w = 100 # a first guessrate = 0.05 # the learning ratefor step in range(1, 7): s = slope(w) w = w - rate * s # a small step downhill print(f"step {step}: slope {s:8.1f}, w = {w:6.2f}, error {error(w):8.1f}")Output
step 1: slope -805.0, w = 140.25, error 1399.3step 2: slope -201.2, w = 150.31, error 133.6step 3: slope -50.3, w = 152.83, error 54.4step 4: slope -12.6, w = 153.46, error 49.5step 5: slope -3.1, w = 153.61, error 49.2step 6: slope -0.8, w = 153.65, error 49.2The slope shrinks as the model nears the bottom, so the steps shrink by themselves. The error stops at about 49, not 0: no single price fits all four bills exactly. The best w is the one with the smallest error, about Rs 153.67.
Thousands of weights at once
A network has many weights, but the idea doesn’t change. The error now depends on all of them. For each weight, find the slope of the error for that weight alone (how the error changes if only that weight is nudged), and move every weight a small step downhill, all at once. The list of all these slopes is the gradient. Picture standing on a hillside in fog: you can’t see the valley, but you can feel which way the ground slopes under your feet, and take a step that way.
Here is a small network learning XOR by itself, from random weights. It has two hidden sigmoid neurons and one output neuron: 9 weights and biases, kept in one list w. Every round, it finds each one’s slope by nudging it, then moves them all downhill:
import mathimport random def sigmoid(z): return 1 / (1 + math.exp(-z)) def network(w, x1, x2): """Two hidden neurons and one output neuron: 9 weights and biases in w.""" h1 = sigmoid(w[0] * x1 + w[1] * x2 + w[2]) h2 = sigmoid(w[3] * x1 + w[4] * x2 + w[5]) return sigmoid(w[6] * h1 + w[7] * h2 + w[8]) examples = [(0, 0, 0), (0, 1, 1), (1, 0, 1), (1, 1, 0)] # XOR def error(w): total = 0 for x1, x2, want in examples: miss = network(w, x1, x2) - want total = total + miss * miss return total / len(examples) random.seed(11)w = [random.uniform(-1, 1) for i in range(9)] # a random startrate = 2.0tiny = 0.0001for rnd in range(1, 3001): e = error(w) slopes = [] for i in range(9): # the slope for each weight in turn w[i] = w[i] + tiny slopes.append((error(w) - e) / tiny) w[i] = w[i] - tiny for i in range(9): # then a small step downhill for all of them w[i] = w[i] - rate * slopes[i] if rnd in (1, 500, 1000, 2000, 3000): print(f"round {rnd:4}: error {error(w):.4f}") for x1, x2, want in examples: print(x1, x2, "->", round(network(w, x1, x2), 2), "wanted", want)Output
round 1: error 0.2505round 500: error 0.2169round 1000: error 0.0045round 2000: error 0.0011round 3000: error 0.00060 0 -> 0.02 wanted 00 1 -> 0.98 wanted 11 0 -> 0.97 wanted 11 1 -> 0.02 wanted 0Nobody told it to make one hidden neuron an OR and the other a NAND. It found weights that work by itself. Look at round 500, too: for hundreds of rounds the error hardly moved, as if the model were crossing a flat plain in the fog, and then it found the way down. Training often goes like that.
Nudging each weight in turn works, but it is slow: for a network with 6,634 parameters, every step would need 6,635 forward passes over all the examples. Real networks find every slope in one go, with a method called backpropagation: after a forward pass, it works backwards from the error at the output, layer by layer, sharing out the blame to each weight. It gives the same slopes as nudging (exactly, where nudging only comes close), far faster. How it does that is calculus you may meet after school; what it does is exactly what you have just seen.
Epochs and batches
Real training goes through its examples many times. One pass through every training example is called an epoch. Training usually takes many epochs, and the examples are shuffled into a new order each time, so the network doesn’t learn anything from their order.
It is also wasteful to change the weights after every single example, and slow to wait for all of them. So the examples are taken a few at a time, in a batch (the network in this unit uses batches of 10): the slopes for the batch are averaged, and the weights take one step. A training run is then: random weights; for each epoch, shuffle the examples; for each batch, a forward pass, backpropagation, and a small step downhill.
What does gradient descent do at each step?
Pick an answer to see why.
Training a network, a student sees the error jump up and down, getting bigger. What is the most likely fix?
Pick an answer to see why.
Training a network to read digits
Now the real thing. To learn digits, a network needs labeled examples: pictures of handwritten digits, each with the digit it shows. This page has two sets of them, both shared freely by the people who made them:
| 0–9 | ०–९ | |
|---|---|---|
| Comes from | MNIST, a famous set published in 1998 by Yann LeCun, Corinna Cortes and Christopher Burges in the United States | the Devanagari Handwritten Character Dataset, by Shailesh Acharya, Ashok Kumar Pant and Prashnna Kumar Gyawali, presented at a conference in Kathmandu in 2015 |
| Whose handwriting | employees of the United States Census Bureau and American high school students, about 250 people for the training set; the test set was written by others | cut from handwritten documents; the set’s description doesn’t say who wrote them |
| Size of the full set | 70,000 digits | 92,000 characters: 36 letters and 10 digits, 2,000 of each |
| License | CC BY-SA 3.0, as stated in the Keras documentation | CC BY 4.0, as stated by the UCI Machine Learning Repository |
| On this page | 2,500 of them: 200 of each digit to train on, 50 to test | the same |
To keep what your phone downloads small (70 to 85 KB for each set), every digit was shrunk to 14 × 14 pixels on our own computer before this page was made, and the page loads them only when you scroll near the widgets. Both licenses let anyone share and change the data as long as they credit its makers (the credit is under each widget); CC BY-SA also asks that changed copies be shared under the same license, so our shrunk MNIST digits are CC BY-SA 3.0 too. The network itself is trained here, in your browser: nothing is sent anywhere.
Before shrinking, each digit was tidied the same way: cut down to the box around its ink, scaled so that its longer side is 10 pixels, and placed in the 14 × 14 square with the center of its ink in the middle. So every training example is about the same size, in the same place.
Notice the gap between the two lines. The network is always better at the examples it trained on than at new ones. That is why the score that counts is the test accuracy, measured on examples the network never learned from, exactly as you did with nearest neighbors in Grade 9 Grade 9: Training, testing and accuracy.
Read your own handwriting
The network trained above can now read digits it has never seen, including yours. The drawing is tidied just as the training digits were, and the network is given the 14 × 14 result.
Overfitting: learning the examples, not the idea
A student who memorizes last year’s question paper word for word may score full marks on that paper, and fail this year’s, where the questions are worded differently. A network can do the same: learn its training examples so exactly that it gets every one right, without learning what makes a 7 a 7. This is called overfitting: the network fits its training examples too closely to do well on new ones. Its sign is a big gap between training accuracy and test accuracy.
Three ways to fight overfitting:
- More data. The surest cure, as the widget shows. With many varied examples, memorizing is no longer the easy way to a small error.
- A smaller network. Fewer parameters can memorize less, so they are pushed to learn the general pattern. Too small, though, and the network can’t learn the pattern either.
- Stop early. Watch the accuracy on examples the network doesn’t train on, epoch by epoch. When it stops rising, stop training: from then on, the extra epochs mostly memorize. In the widget with 100 examples, from about epoch 12 on, training accuracy climbs from about 93% to 100% while test accuracy gains only about 3 points.
A network gets 99% of its training examples right but only 60% of its test examples. What is happening, and what would help most?
Pick an answer to see why.
What did it learn?
A network is just numbers, but some of them can be looked at. The easiest to look at belong to the simplest network: one with no hidden layer at all, where each of the ten output neurons looks straight at the 196 pixels. Each output neuron has one weight per pixel, so its weights can be drawn as a 14 × 14 picture of their own: blue where ink makes the neuron say “this is my digit”, red where ink makes it say “not mine”.
So what has it learned? Something like a stencil for each digit: where ink usually is, and where it usually isn’t. That works surprisingly well when digits are written in the usual way, at the usual size, in the middle. It is not what you do when you read. You know a 4 has a closed or open corner and a line down the side, wherever it is and however big. The network has no idea of a line, a corner or a loop. It knows pixels.
A network with a hidden layer is harder to read: each hidden neuron looks for some pattern of pixels, and the outputs combine them, so its parts don’t have simple meanings. Finding out what large networks have learned is a whole field of research, called interpretability.
Where it fails
A model’s mistakes show what it really learned. Here are the test digits the network gets wrong.
Your own tests in Read my handwriting showed more failures, of three kinds:
- Things it never saw. Drawn small in a corner, with Tidy off, a digit lands on pixels where the training digits had no ink, so the weights there were never trained, and the answer is nonsense.
- Styles it never saw. A digit written in a way that wasn’t in its examples, like a 7 with a bar across it if few of its examples had one.
- Confidently wrong. The network always gives an answer, and often gives a wrong one with a high chance. A chance of 98% means “this looks very like the 7s I trained on”, not “I am 98% sure, and I am right 98% of the time”.
Network or nearest neighbors?
On the same 2,000 training digits, the nearest-neighbor model of Grade 9 (with k = 1: each test digit gets the label of the single most similar training picture, measured by the distance between their 196 pixel values) did better than our network. The numbers, from the widgets on this page:
| Nearest neighbor | Neural network (32 hidden neurons) | |
|---|---|---|
| Test accuracy, 0–9 | 91.8% | 89.2% |
| Test accuracy, ०–९ | 97.2% | 93.0% |
| Training | none: it keeps the examples | 15 epochs of gradient descent |
| What it keeps | all 2,000 pictures: 392,000 numbers | 6,634 parameters |
| Work to read one digit | compare with all 2,000 pictures: 392,000 subtractions | about 6,600 multiplications |
| Can it say why? | yes: “it looks most like this training digit” | not easily |
So which is better? It depends on the task, and that is how to choose a kind of model: by what the task needs, not by what is newest.
- On a small set of small, tidy pictures, nearest neighbors is accurate, needs no training, and can show the training picture it matched. Here it wins.
- As the data grows, nearest neighbors grows with it: every new example is one more picture to keep and to compare with every time it answers. A network with a million training examples is no bigger, and no slower to answer, than one with a thousand. A phone that reads digits must answer quickly, without keeping every example ever written.
- With much more data, networks win on accuracy too. On the full MNIST set of 60,000 training digits, nearest neighbors gets about 97% of the test digits right and a well-trained network with one bigger hidden layer, like ours but with hundreds of hidden neurons, about 98%, and networks designed for pictures (called convolutional networks, which look for the same small shapes at every place in the picture) make fewer than 1 mistake in 100.
Judging the training data
A network can only learn what is in its examples. So before trusting a model, judge the data it was trained on. Five questions to ask of any training data:
- Source. Where did it come from, who collected it, and why?
- Quality. Are the labels right? Are there blurred, cut-off or mislabeled examples?
- Representativeness. Is it like the data the model will meet in use? Does it cover all the kinds of people, places and situations it will meet?
- Bias. Is any group left out or under-represented, so that the model works worse for them? (Grade 7 called this one-sided examples: One-sided examples: bias.)
- Privacy. Whose data is it? Did they agree to it being used this way? Could it identify them?
Ask them of the 0–9 digits. The source is clear and published. Its quality is good, but not perfect: researchers have found a few digits in MNIST that even people can’t read, and some that look mislabeled. Its representativeness is the big question for us. The digits were written in the United States, by about 250 people for the training part: Census Bureau employees and high school students. Handwriting differs from place to place: in much of Europe a 7 is often written with a bar across it and a 1 with a long flag, while most Americans write both plainly. How does your class write them? If differently from the training digits, a network trained only on them may read your handwriting worse than an American student’s: a bias that comes from where the examples came from, not from anything wrong in the code. And privacy: handwriting is personal. Those people filled in forms for a research collection around 1990; they could not have imagined their digits being used by millions of students, researchers and companies thirty years later.
A company in Kathmandu wants to read handwritten amounts on forms filled in all over Nepal, in Devanagari digits. It trains a network only on digits written by its own office staff in Kathmandu. Which problem is it most likely to have?
Pick an answer to see why.
Make a model of your own
You have trained a network on data someone else collected. The real work of building a model starts earlier: choosing the task and collecting the examples. Try the whole process on the page.
The steps you just followed are the steps of building any model:
- Choose the task, and check that learning from examples is the right tool: is there a rule you could write instead?
- Collect examples that are like what the model will meet: many people, many styles, all the classes in fair numbers. Label them carefully.
- Train a model, and keep some examples aside, never trained on.
- Test it on those, and on new people, and look at the mistakes, not only the accuracy.
- Improve the data where it fails (Grade 7’s Fixing a model by fixing its data), and train again.

Project: a digit reader for your class
In short
Exercise
What is the output of a step neuron with inputs 1 and 1, weights 0.5 and −2, and bias 1?
Pick an answer to see why.
Which weights and bias make a two-input step neuron act as an OR gate?
Pick an answer to see why.
What is a hidden layer?
Pick an answer to see why.
In gradient descent, the slope of the error for a weight is +30 and the learning rate is 0.1. What happens to the weight?
Pick an answer to see why.
What is an epoch?
Pick an answer to see why.
Which of these is the clearest sign of overfitting?
Pick an answer to see why.
Why is the nearest-neighbor model slower to answer than a trained network when it has a million training examples?
Pick an answer to see why.
Explain these words, each in a sentence or two: weight, bias, activation function, hidden layer, forward pass, learning rate, epoch.
Answer
A shop’s neuron decides whether to give a customer a discount. Inputs: a regular customer (1 or 0), spending over Rs 2,000 (1 or 0), paying by phone (1 or 0). Weights 2, 3 and 1; bias −3.5; step activation. Make a table of the output for all eight combinations of inputs. In words, what rule has the neuron learned?
Answer
Explain, with a drawing of the square of inputs, why no single neuron can act as an XOR gate, and show how a network of three neurons can.
Answer
Work out the forward pass of the XOR network in Figure 8.3 for the input (1, 0): the outputs of h₁, h₂ and the output neuron, showing each weighted sum.
Answer
A network reads 28 × 28 pixel pictures, has one hidden layer of 64 neurons and 10 outputs. How many parameters (weights and biases) does it have? How many would it have with 128 hidden neurons? Which is more likely to overfit on 500 training examples, and why?
Answer
In the momo example, the model starts at w = Rs 100 and the slope there is −805. With a learning rate of 0.05, what is w after one step? Why does the step get smaller as w nears the best price, even though the learning rate stays the same?
Answer
Explain gradient descent to a friend who has never studied calculus, using the picture of walking down a hill in fog. In your explanation, say what the hill, your position, the slope and the size of your step stand for.
Answer
A student trains a network on 100 handwritten digits for 50 epochs and reports “my model is 100% accurate”. Give two things wrong with this claim and say how to measure the model properly.
Answer
The digit network’s ten output chances for a drawing are 0.97 for 7 and small numbers for the rest, but the drawing was a 1. Explain how the network can be so sure and still wrong. What does this mean for using such networks where mistakes matter?
Answer
Evaluate this training data for a network that will read the handwritten marks teachers write on SEE answer sheets all over Nepal: 5,000 digits written by 20 teachers at one school in Lalitpur, collected by asking them to fill in practice sheets. Use the five questions of “Judging the training data”, and suggest how to make the data better.
Answer
For each task, choose a set of rules written by people, a nearest-neighbor model, or a neural network, and justify your choice: (i) reading the handwritten amount on a bank deposit slip; (ii) working out the late fee on a library book from the number of days late, at Rs 5 a day; (iii) guessing which of five kinds of tea leaf a sample is, from four measurements, with 200 labeled samples, where the tea board wants to see why each guess was made.
Answer
Our digit network had 89.2% test accuracy and the nearest-neighbor model 91.8%, on the same examples. A friend says: “So neural networks are worse than nearest neighbors.” Do you agree? Explain, using what changes when there are many more training examples.
Answer
Quiz yourself: Artificial intelligence, Grades 6–12 →
Practice every question in the book, and keep track of the ones you miss →